Ichimoku Trading Signals 2Swing Trading (Strategy 1, H4+ timeframes)
Use the Kumo Cloud to identify the trend: price above a green cloud = uptrend; price below a red cloud = downtrend.
Entry signals occur when price or the Tenkan-sen line crosses the Kijun-sen line, confirmed by Chikou Span momentum.
Exit triggers when price crosses back through the Kijun-sen or when Tenkan-sen crosses back below (for long positions) or above (for short positions).
Place stop-loss orders just beyond the nearest swing low/high candle cluster to manage risk tightly.
Cerca negli script per "swing trading"

BloodSwing Indicator-SWING TRADING STRATEGY FOR PASSIVE TRADERS-
A Multi-timeframe Strategy
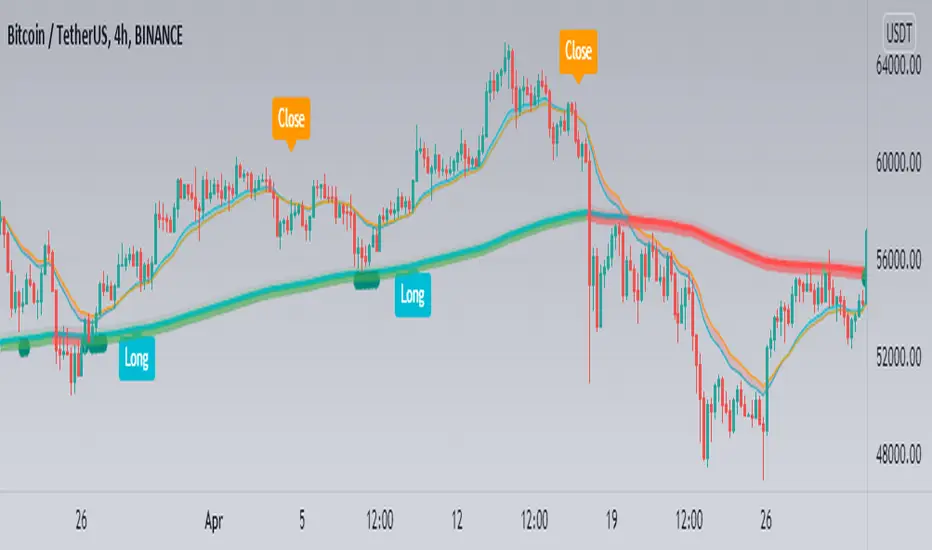
This swing trading strategy uses three moving averages pegged to the 4H timeframe, to enter and exit the market on the 1H timeframe.
The 200 EMA (4H timeframe) is used to identify areas of support. If this moving average shows signs of support (shown as green circles under candles), the 18 and 22 moving average (4hour timeframe) crossover is used to enter the market, but on the 1 hour chart (for more accuracy) and only after an increase in volume on the 1 hour timeframe has been detected.
Manually this strategy is explained as follows:
1. Look for candle support on 200 MA (4H Timeframe)
2. On the 1H chart, look for the crossover of 18 and 22 ma (4H Timeframe)
3. As soon as you see volume increase on 1H, enter.
4. Exit on cross under of 18 and 22 ma (4H Timeframe)
5. Stop Loss below 200EMA support candle low.
Signals:
- Support signals are shown as green circles under the candles
- Long, Close, Stop signals are shown as labels and can be toggled on and off.
Extras (In option menu):
MA Deviation:
A standard deviation measure used on the 200 EMA in order to provide some range for support signals to be considered valid.
Use volume expansion for entry:
As an option (on by default), you can disable volume increase as a condition for entry.

SWING TRADER V4 swing trading script (on test)
Long = buy signal
Short = sell signal
simple buy/sell script confirmed on bar close
Use ema's for the stoploss once price goes above or below these ema's
alerts available

SWING TRADER PRO V4 swing trading script currently scalper available
Long = buy signal
Short = sell signal
Use ema's for the stoploss once price goes above or below these ema's
best use on 1 hour
orange bar color indicates overbought
lime bar color indicates oversold
you can also add alerts for signals

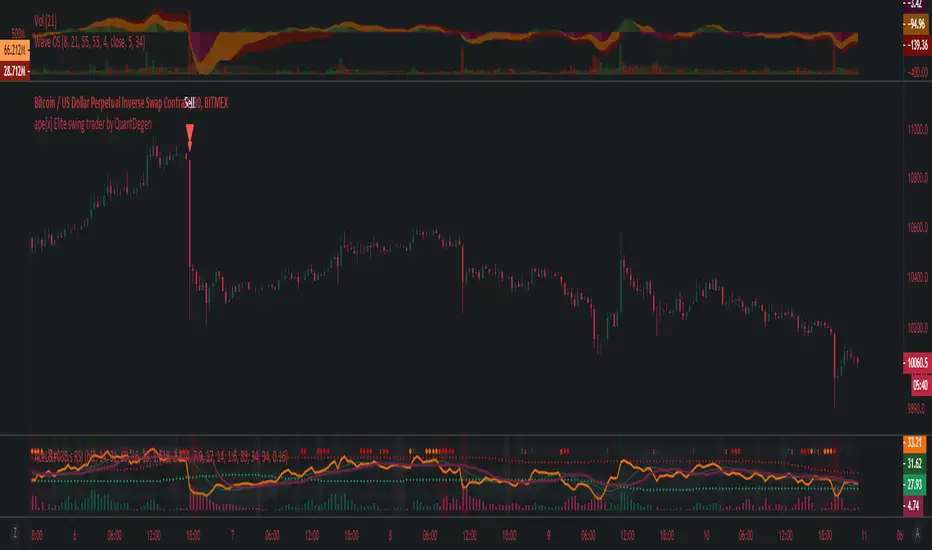

Swinging Karate Monkey Death CrossingSwing trading method extrapolated to 1h chart for margin trading, due to liq prices being too short to be use on 1d chart, been tested on btc margin trading, but should work for other markets/pairs
instruccions are very simple
if green line crosses over red line, go long
if green line crosses under red line, go short
try to open as close as posible to the crossing (if too far away from price/time, wait for next crossing), exit at the next crossing

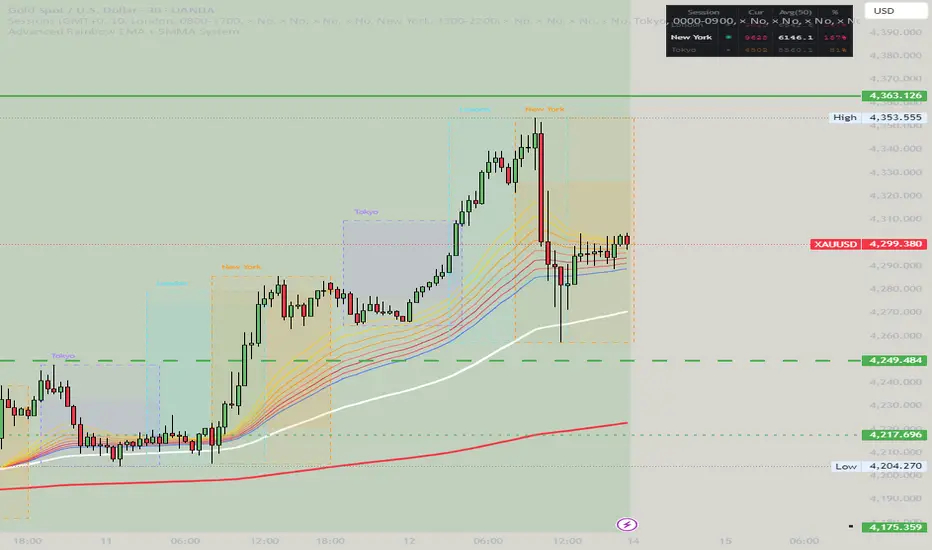
Advanced Rainbow EMA + SMMA System - VILLAGE PILOT Advanced Rainbow EMA + SMMA System
This custom indicator overlays eight rainbow‑colored EMAs (20, 25, 30, 35, 40, 45, 50, 55) together with two Smoothed Moving Averages (SMMA 50 in white, SMMA 200 in red).
Features:
🌈 Rainbow EMAs: Smooth gradient from yellow → gold → orange → dark orange → tomato → crimson → red → blue, showing short‑ to medium‑term momentum.
⚪🔴 Smoothed Moving Averages: Thick white SMMA (50) and thick red SMMA (200) for long‑term trend context.
🟩🟥 Background shading: Green when EMAs align bullish and SMMA 50 > SMMA 200, red when bearish.
📈📉 Signal arrows: “BUY” labels on Golden Cross (SMMA 50 crossing above SMMA 200), “SELL” labels on Death Cross (SMMA 50 crossing below SMMA 200).
🔔 Alerts: Built‑in TradingView alerts for Golden/Death Cross and for strong bullish/bearish EMA alignment.
Use case: This tool helps traders quickly visualize short‑term momentum against long‑term smoothed trend direction. It highlights strong trending conditions, potential reversals, and crossover signals, making it suitable for swing trading, trend following, and confirmation of entries/exits.
Ultimate RSI [captainua]Ultimate RSI
Overview
This indicator combines multiple RSI calculations with volume analysis, divergence detection, and trend filtering to provide a comprehensive RSI-based trading system. The script calculates RSI using three different periods (6, 14, 24) and applies various smoothing methods to reduce noise while maintaining responsiveness. The combination of these features creates a multi-layered confirmation system that reduces false signals by requiring alignment across multiple indicators and timeframes.
The script includes optimized configuration presets for instant setup: Scalping, Day Trading, Swing Trading, and Position Trading. Simply select a preset to instantly configure all settings for your trading style, or use Custom mode for full manual control. All settings include automatic input validation to prevent configuration errors and ensure optimal performance.
Configuration Presets
The script includes preset configurations optimized for different trading styles, allowing you to instantly configure the indicator for your preferred trading approach. Simply select a preset from the "Configuration Preset" dropdown menu:
- Scalping: Optimized for fast-paced trading with shorter RSI periods (4, 7, 9) and minimal smoothing. Noise reduction is automatically disabled, and momentum confirmation is disabled to allow faster signal generation. Designed for quick entries and exits in volatile markets.
- Day Trading: Balanced configuration for intraday trading with moderate RSI periods (6, 9, 14) and light smoothing. Momentum confirmation is enabled for better signal quality. Ideal for day trading strategies requiring timely but accurate signals.
- Swing Trading: Configured for medium-term positions with standard RSI periods (14, 14, 21) and moderate smoothing. Provides smoother signals suitable for swing trading timeframes. All noise reduction features remain active.
- Position Trading: Optimized for longer-term trades with extended RSI periods (24, 21, 28) and heavier smoothing. Filters are configured for highest-quality signals. Best for position traders holding trades over multiple days or weeks.
- Custom: Full manual control over all settings. All input parameters are available for complete customization. This is the default mode and maintains full backward compatibility with previous versions.
When a preset is selected, it automatically adjusts RSI periods, smoothing lengths, and filter settings to match the trading style. The preset configurations ensure optimal settings are applied instantly, eliminating the need for manual configuration. All settings can still be manually overridden if needed, providing flexibility while maintaining ease of use.
Input Validation and Error Prevention
The script includes comprehensive input validation to prevent configuration errors:
- Cross-Input Validation: Smoothing lengths are automatically validated to ensure they are always less than their corresponding RSI period length. If you set a smoothing length greater than or equal to the RSI length, the script automatically adjusts it to (RSI Length - 1). This prevents logical errors and ensures valid configurations.
- Input Range Validation: All numeric inputs have minimum and maximum value constraints enforced by TradingView's input system, preventing invalid parameter values.
- Smart Defaults: Preset configurations use validated default values that are tested and optimized for each trading style. When switching between presets, all related settings are automatically updated to maintain consistency.
Core Calculations
Multi-Period RSI:
The script calculates RSI using the standard Wilder's RSI formula: RSI = 100 - (100 / (1 + RS)), where RS = Average Gain / Average Loss over the specified period. Three separate RSI calculations run simultaneously:
- RSI(6): Uses 6-period lookback for high sensitivity to recent price changes, useful for scalping and early signal detection
- RSI(14): Standard 14-period RSI for balanced analysis, the most commonly used RSI period
- RSI(24): Longer 24-period RSI for trend confirmation, provides smoother signals with less noise
Each RSI can be smoothed using EMA, SMA, RMA (Wilder's smoothing), WMA, or Zero-Lag smoothing. Zero-Lag smoothing uses the formula: ZL-RSI = RSI + (RSI - RSI ) to reduce lag while maintaining signal quality. You can apply individual smoothing lengths to each RSI period, or use global smoothing where all three RSIs share the same smoothing length.
Dynamic Overbought/Oversold Thresholds:
Static thresholds (default 70/30) are adjusted based on market volatility using ATR. The formula: Dynamic OB = Base OB + (ATR × Volatility Multiplier × Base Percentage / 100), Dynamic OS = Base OS - (ATR × Volatility Multiplier × Base Percentage / 100). This adapts to volatile markets where traditional 70/30 levels may be too restrictive. During high volatility, the dynamic thresholds widen, and during low volatility, they narrow. The thresholds are clamped between 0-100 to remain within RSI bounds. The ATR is cached for performance optimization, updating on confirmed bars and real-time bars.
Adaptive RSI Calculation:
An adaptive RSI adjusts the standard RSI(14) based on current volatility relative to average volatility. The calculation: Adaptive Factor = (Current ATR / SMA of ATR over 20 periods) × Volatility Multiplier. If SMA of ATR is zero (edge case), the adaptive factor defaults to 0. The adaptive RSI = Base RSI × (1 + Adaptive Factor), clamped to 0-100. This makes the indicator more responsive during high volatility periods when traditional RSI may lag. The adaptive RSI is used for signal generation (buy/sell signals) but is not plotted on the chart.
Overbought/Oversold Fill Zones:
The script provides visual fill zones between the RSI line and the threshold lines when RSI is in overbought or oversold territory. The fill logic uses inclusive conditions: fills are shown when RSI is currently in the zone OR was in the zone on the previous bar. This ensures complete coverage of entry and exit boundaries. A minimum gap of 0.1 RSI points is maintained between the RSI plot and threshold line to ensure reliable polygon rendering in TradingView. The fill uses invisible plots at the threshold levels and the RSI value, with the fill color applied between them. You can select which RSI (6, 14, or 24) to use for the fill zones.
Divergence Detection
Regular Divergence:
Bullish divergence: Price makes a lower low (current low < lowest low from previous lookback period) while RSI makes a higher low (current RSI > lowest RSI from previous lookback period). Bearish divergence: Price makes a higher high (current high > highest high from previous lookback period) while RSI makes a lower high (current RSI < highest RSI from previous lookback period). The script compares current price/RSI values to the lowest/highest values from the previous lookback period using ta.lowest() and ta.highest() functions with index to reference the previous period's extreme.
Pivot-Based Divergence:
An enhanced divergence detection method that uses actual pivot points instead of simple lowest/highest comparisons. This provides more accurate divergence detection by identifying significant pivot lows/highs in both price and RSI. The pivot-based method uses a tolerance-based approach with configurable constants: 1% tolerance for price comparisons (priceTolerancePercent = 0.01) and 1.0 RSI point absolute tolerance for RSI comparisons (pivotTolerance = 1.0). Minimum divergence threshold is 1.0 RSI point (minDivergenceThreshold = 1.0). It looks for two recent pivot points and compares them: for bullish divergence, price makes a lower low (at least 1% lower) while RSI makes a higher low (at least 1.0 point higher). This method reduces false divergences by requiring actual pivot points rather than just any low/high within a period. When enabled, pivot-based divergence replaces the traditional method for more accurate signal generation.
Strong Divergence:
Regular divergence is confirmed by an engulfing candle pattern. Bullish engulfing requires: (1) Previous candle is bearish (close < open ), (2) Current candle is bullish (close > open), (3) Current close > previous open, (4) Current open < previous close. Bearish engulfing is the inverse: previous bullish, current bearish, current close < previous open, current open > previous close. Strong divergence signals are marked with visual indicators (🐂 for bullish, 🐻 for bearish) and have separate alert conditions.
Hidden Divergence:
Continuation patterns that signal trend continuation rather than reversal. Bullish hidden divergence: Price makes a higher low (current low > lowest low from previous period) but RSI makes a lower low (current RSI < lowest RSI from previous period). Bearish hidden divergence: Price makes a lower high (current high < highest high from previous period) but RSI makes a higher high (current RSI > highest RSI from previous period). These patterns indicate the trend is likely to continue in the current direction.
Volume Confirmation System
Volume threshold filtering requires current volume to exceed the volume SMA multiplied by the threshold factor. The formula: Volume Confirmed = Volume > (Volume SMA × Threshold). If the threshold is set to 0.1 or lower, volume confirmation is effectively disabled (always returns true). This allows you to use the indicator without volume filtering if desired.
Volume Climax is detected when volume exceeds: Volume SMA + (Volume StdDev × Multiplier). This indicates potential capitulation moments where extreme volume accompanies price movements. Volume Dry-Up is detected when volume falls below: Volume SMA - (Volume StdDev × Multiplier), indicating low participation periods that may produce unreliable signals. The volume SMA is cached for performance, updating on confirmed and real-time bars.
Multi-RSI Synergy
The script generates signals when multiple RSI periods align in overbought or oversold zones. This creates a confirmation system that reduces false signals. In "ALL" mode, all three RSIs (6, 14, 24) must be simultaneously above the overbought threshold OR all three must be below the oversold threshold. In "2-of-3" mode, any two of the three RSIs must align in the same direction. The script counts how many RSIs are in each zone: twoOfThreeOB = ((rsi6OB ? 1 : 0) + (rsi14OB ? 1 : 0) + (rsi24OB ? 1 : 0)) >= 2.
Synergy signals require: (1) Multi-RSI alignment (ALL or 2-of-3), (2) Volume confirmation, (3) Reset condition satisfied (enough bars since last synergy signal), (4) Additional filters passed (RSI50, Trend, ADX, Volume Dry-Up avoidance). Separate reset conditions track buy and sell signals independently. The reset condition uses ta.barssince() to count bars since the last trigger, returning true if the condition never occurred (allowing first signal) or if enough bars have passed.
Regression Forecasting
The script uses historical RSI values to forecast future RSI direction using four methods. The forecast horizon is configurable (1-50 bars ahead). Historical data is collected into an array, and regression coefficients are calculated based on the selected method.
Linear Regression: Calculates the least-squares fit line (y = mx + b) through the last N RSI values. The calculation: meanX = sumX / horizon, meanY = sumY / horizon, denominator = sumX² - horizon × meanX², m = (sumXY - horizon × meanX × meanY) / denominator, b = meanY - m × meanX. The forecast projects this line forward: forecast = b + m × i for i = 1 to horizon.
Polynomial Regression: Fits a quadratic curve (y = ax² + bx + c) to capture non-linear trends. The system of equations is solved using Cramer's rule with a 3×3 determinant. If the determinant is too small (< 0.0001), the system falls back to linear regression. Coefficients are calculated by solving: n×c + sumX×b + sumX²×a = sumY, sumX×c + sumX²×b + sumX³×a = sumXY, sumX²×c + sumX³×b + sumX⁴×a = sumX²Y. Note: Due to the O(n³) computational complexity of polynomial regression, the forecast horizon is automatically limited to a maximum of 20 bars when using polynomial regression to maintain optimal performance. If you set a horizon greater than 20 bars with polynomial regression, it will be automatically capped at 20 bars.
Exponential Smoothing: Applies exponential smoothing with adaptive alpha = 2/(horizon+1). The smoothing iterates from oldest to newest value: smoothed = alpha × series + (1 - alpha) × smoothed. Trend is calculated by comparing current smoothed value to an earlier smoothed value (at 60% of horizon): trend = (smoothed - earlierSmoothed) / (horizon - earlierIdx). Forecast: forecast = base + trend × i.
Moving Average: Uses the difference between short MA (horizon/2) and long MA (horizon) to estimate trend direction. Trend = (maShort - maLong) / (longLen - shortLen). Forecast: forecast = maShort + trend × i.
Confidence bands are calculated using RMSE (Root Mean Squared Error) of historical forecast accuracy. The error calculation compares historical values with forecast values: RMSE = sqrt(sumSquaredError / count). If insufficient data exists, it falls back to calculating standard deviation of recent RSI values. Confidence bands = forecast ± (RMSE × confidenceLevel). All forecast values and confidence bands are clamped to 0-100 to remain within RSI bounds. The regression functions include comprehensive safety checks: horizon validation (must not exceed array size), empty array handling, edge case handling for horizon=1 scenarios, division-by-zero protection, and bounds checking for all array access operations to prevent runtime errors.
Strong Top/Bottom Detection
Strong buy signals require three conditions: (1) RSI is at its lowest point within the bottom period: rsiVal <= ta.lowest(rsiVal, bottomPeriod), (2) RSI is below the oversold threshold minus a buffer: rsiVal < (oversoldThreshold - rsiTopBottomBuffer), where rsiTopBottomBuffer = 2.0 RSI points, (3) The absolute difference between current RSI and the lowest RSI exceeds the threshold value: abs(rsiVal - ta.lowest(rsiVal, bottomPeriod)) > threshold. This indicates a bounce from extreme levels with sufficient distance from the absolute low.
Strong sell signals use the inverse logic: RSI at highest point, above overbought threshold + rsiTopBottomBuffer (2.0 RSI points), and difference from highest exceeds threshold. Both signals also require: volume confirmation, reset condition satisfied (separate reset for buy vs sell), and all additional filters passed (RSI50, Trend, ADX, Volume Dry-Up avoidance).
The reset condition uses separate logic for buy and sell: resetCondBuy checks bars since isRSIAtBottom, resetCondSell checks bars since isRSIAtTop. This ensures buy signals reset based on bottom conditions and sell signals reset based on top conditions, preventing incorrect signal blocking.
Filtering System
RSI(50) Filter: Only allows buy signals when RSI(14) > 50 (bullish momentum) and sell signals when RSI(14) < 50 (bearish momentum). This filter ensures you're buying in uptrends and selling in downtrends from a momentum perspective. The filter is optional and can be disabled. Recommended to enable for noise reduction.
Trend Filter: Uses a long-term EMA (default 200) to determine trend direction. Buy signals require price above EMA, sell signals require price below EMA. The EMA slope is calculated as: emaSlope = ema - ema . Optional EMA slope filter additionally requires the EMA to be rising (slope > 0) for buy signals or falling (slope < 0) for sell signals. This provides stronger trend confirmation by requiring both price position and EMA direction.
ADX Filter: Uses the Directional Movement Index (calculated via ta.dmi()) to measure trend strength. Signals only fire when ADX exceeds the threshold (default 20), indicating a strong trend rather than choppy markets. The ADX calculation uses separate length and smoothing parameters. This filter helps avoid signals during sideways/consolidation periods.
Volume Dry-Up Avoidance: Prevents signals during periods of extremely low volume relative to average. If volume dry-up is detected and the filter is enabled, signals are blocked. This helps avoid unreliable signals that occur during low participation periods.
RSI Momentum Confirmation: Requires RSI to be accelerating in the signal direction before confirming signals. For buy signals, RSI must be consistently rising (recovering from oversold) over the lookback period. For sell signals, RSI must be consistently falling (declining from overbought) over the lookback period. The momentum check verifies that all consecutive changes are in the correct direction AND the cumulative change is significant. This filter ensures signals only fire when RSI momentum aligns with the signal direction, reducing false signals from weak momentum.
Multi-Timeframe Confirmation: Requires higher timeframe RSI to align with the signal direction. For buy signals, current RSI must be below the higher timeframe RSI by at least the confirmation threshold. For sell signals, current RSI must be above the higher timeframe RSI by at least the confirmation threshold. This ensures signals align with the larger trend context, reducing counter-trend trades. The higher timeframe RSI is fetched using request.security() from the selected timeframe.
All filters use the pattern: filterResult = not filterEnabled OR conditionMet. This means if a filter is disabled, it always passes (returns true). Filters can be combined, and all must pass for a signal to fire.
RSI Centerline and Period Crossovers
RSI(50) Centerline Crossovers: Detects when the selected RSI source crosses above or below the 50 centerline. Bullish crossover: ta.crossover(rsiSource, 50), bearish crossover: ta.crossunder(rsiSource, 50). You can select which RSI (6, 14, or 24) to use for these crossovers. These signals indicate momentum shifts from bearish to bullish (above 50) or bullish to bearish (below 50).
RSI Period Crossovers: Detects when different RSI periods cross each other. Available pairs: RSI(6) × RSI(14), RSI(14) × RSI(24), or RSI(6) × RSI(24). Bullish crossover: fast RSI crosses above slow RSI (ta.crossover(rsiFast, rsiSlow)), indicating momentum acceleration. Bearish crossover: fast RSI crosses below slow RSI (ta.crossunder(rsiFast, rsiSlow)), indicating momentum deceleration. These crossovers can signal shifts in momentum before price moves.
StochRSI Calculation
Stochastic RSI applies the Stochastic oscillator formula to RSI values instead of price. The calculation: %K = ((RSI - Lowest RSI) / (Highest RSI - Lowest RSI)) × 100, where the lookback is the StochRSI length. If the range is zero, %K defaults to 50.0. %K is then smoothed using SMA with the %K smoothing length. %D is calculated as SMA of smoothed %K with the %D smoothing length. All values are clamped to 0-100. You can select which RSI (6, 14, or 24) to use as the source for StochRSI calculation.
RSI Bollinger Bands
Bollinger Bands are applied to RSI(14) instead of price. The calculation: Basis = SMA(RSI(14), BB Period), StdDev = stdev(RSI(14), BB Period), Upper = Basis + (StdDev × Deviation Multiplier), Lower = Basis - (StdDev × Deviation Multiplier). This creates dynamic zones around RSI that adapt to RSI volatility. When RSI touches or exceeds the bands, it indicates extreme conditions relative to recent RSI behavior.
Noise Reduction System
The script includes a comprehensive noise reduction system to filter false signals and improve accuracy. When enabled, signals must pass multiple quality checks:
Signal Strength Requirement: RSI must be at least X points away from the centerline (50). For buy signals, RSI must be at least X points below 50. For sell signals, RSI must be at least X points above 50. This ensures signals only trigger when RSI is significantly in oversold/overbought territory, not just near neutral.
Extreme Zone Requirement: RSI must be deep in the OB/OS zone. For buy signals, RSI must be at least X points below the oversold threshold. For sell signals, RSI must be at least X points above the overbought threshold. This ensures signals only fire in extreme conditions where reversals are more likely.
Consecutive Bar Confirmation: The signal condition must persist for N consecutive bars before triggering. This reduces false signals from single-bar spikes or noise. The confirmation checks that the signal condition was true for all bars in the lookback period.
Zone Persistence (Optional): Requires RSI to remain in the OB/OS zone for N consecutive bars, not just touch it. This ensures RSI is truly in an extreme state rather than just briefly touching the threshold. When enabled, this provides stricter filtering for higher-quality signals.
RSI Slope Confirmation (Optional): Requires RSI to be moving in the expected signal direction. For buy signals, RSI should be rising (recovering from oversold). For sell signals, RSI should be falling (declining from overbought). This ensures momentum is aligned with the signal direction. The slope is calculated by comparing current RSI to RSI N bars ago.
All noise reduction filters can be enabled/disabled independently, allowing you to customize the balance between signal frequency and accuracy. The default settings provide a good balance, but you can adjust them based on your trading style and market conditions.
Alert System
The script includes separate alert conditions for each signal type: buy/sell (adaptive RSI crossovers), divergence (regular, strong, hidden), crossovers (RSI50 centerline, RSI period crossovers), synergy signals, and trend breaks. Each alert type has its own alertcondition() declaration with a unique title and message.
An optional cooldown system prevents alert spam by requiring a minimum number of bars between alerts of the same type. The cooldown check: canAlert = na(lastAlertBar) OR (bar_index - lastAlertBar >= cooldownBars). If the last alert bar is na (first alert), it always allows the alert. Each alert type maintains its own lastAlertBar variable, so cooldowns are independent per signal type. The default cooldown is 10 bars, which is recommended for noise reduction.
Higher Timeframe RSI
The script can display RSI from a higher timeframe using request.security(). This allows you to see the RSI context from a larger timeframe (e.g., daily RSI on an hourly chart). The higher timeframe RSI uses RSI(14) calculation from the selected timeframe. This provides context for the current timeframe's RSI position relative to the larger trend.
RSI Pivot Trendlines
The script can draw trendlines connecting pivot highs and lows on RSI(6). This feature helps visualize RSI trends and identify potential trend breaks.
Pivot Detection: Pivots are detected using a configurable period. The script can require pivots to have minimum strength (RSI points difference from surrounding bars) to filter out weak pivots. Lower minPivotStrength values detect more pivots (more trendlines), while higher values detect only stronger pivots (fewer but more significant trendlines). Pivot confirmation is optional: when enabled, the script waits N bars to confirm the pivot remains the extreme, reducing repainting. Pivot confirmation functions (f_confirmPivotLow and f_confirmPivotHigh) are always called on every bar for consistency, as recommended by TradingView. When pivot bars are not available (na), safe default values are used, and the results are then used conditionally based on confirmation settings. This ensures consistent calculations and prevents calculation inconsistencies.
Trendline Drawing: Uptrend lines connect confirmed pivot lows (green), and downtrend lines connect confirmed pivot highs (red). By default, only the most recent trendline is shown (old trendlines are deleted when new pivots are confirmed). This keeps the chart clean and uncluttered. If "Keep Historical Trendlines" is enabled, the script preserves up to N historical trendlines (configurable via "Max Trendlines to Keep", default 5). When historical trendlines are enabled, old trendlines are saved to arrays instead of being deleted, allowing you to see multiple trendlines simultaneously for better trend analysis. The arrays are automatically limited to prevent memory accumulation.
Trend Break Detection: Signals are generated when RSI breaks above or below trendlines. Uptrend breaks (RSI crosses below uptrend line) generate buy signals. Downtrend breaks (RSI crosses above downtrend line) generate sell signals. Optional trend break confirmation requires the break to persist for N bars and optionally include volume confirmation. Trendline angle filtering can exclude flat/weak trendlines from generating signals (minTrendlineAngle > 0 filters out weak/flat trendlines).
How Components Work Together
The combination of multiple RSI periods provides confirmation across different timeframes, reducing false signals. RSI(6) catches early moves, RSI(14) provides balanced signals, and RSI(24) confirms longer-term trends. When all three align (synergy), it indicates strong consensus across timeframes.
Volume confirmation ensures signals occur with sufficient market participation, filtering out low-volume false breakouts. Volume climax detection identifies potential reversal points, while volume dry-up avoidance prevents signals during unreliable low-volume periods.
Trend filters align signals with the overall market direction. The EMA filter ensures you're trading with the trend, and the EMA slope filter adds an additional layer by requiring the trend to be strengthening (rising EMA for buys, falling EMA for sells).
ADX filter ensures signals only fire during strong trends, avoiding choppy/consolidation periods. RSI(50) filter ensures momentum alignment with the trade direction.
Momentum confirmation requires RSI to be accelerating in the signal direction, ensuring signals only fire when momentum is aligned. Multi-timeframe confirmation ensures signals align with higher timeframe trends, reducing counter-trend trades.
Divergence detection identifies potential reversals before they occur, providing early warning signals. Pivot-based divergence provides more accurate detection by using actual pivot points. Hidden divergence identifies continuation patterns, useful for trend-following strategies.
The noise reduction system combines multiple filters (signal strength, extreme zone, consecutive bars, zone persistence, RSI slope) to significantly reduce false signals. These filters work together to ensure only high-quality signals are generated.
The synergy system requires alignment across all RSI periods for highest-quality signals, significantly reducing false positives. Regression forecasting provides forward-looking context, helping anticipate potential RSI direction changes.
Pivot trendlines provide visual trend analysis and can generate signals when RSI breaks trendlines, indicating potential reversals or continuations.
Reset conditions prevent signal spam by requiring a minimum number of bars between signals. Separate reset conditions for buy and sell signals ensure proper signal management.
Usage Instructions
Configuration Presets (Recommended): The script includes optimized preset configurations for instant setup. Simply select your trading style from the "Configuration Preset" dropdown:
- Scalping Preset: RSI(4, 7, 9) with minimal smoothing. Noise reduction disabled, momentum confirmation disabled for fastest signals.
- Day Trading Preset: RSI(6, 9, 14) with light smoothing. Momentum confirmation enabled for better signal quality.
- Swing Trading Preset: RSI(14, 14, 21) with moderate smoothing. Balanced configuration for medium-term trades.
- Position Trading Preset: RSI(24, 21, 28) with heavier smoothing. Optimized for longer-term positions with all filters active.
- Custom Mode: Full manual control over all settings. Default behavior matches previous script versions.
Presets automatically configure RSI periods, smoothing lengths, and filter settings. You can still manually adjust any setting after selecting a preset if needed.
Getting Started: The easiest way to get started is to select a configuration preset matching your trading style (Scalping, Day Trading, Swing Trading, or Position Trading) from the "Configuration Preset" dropdown. This instantly configures all settings for optimal performance. Alternatively, use "Custom" mode for full manual control. The default configuration (Custom mode) shows RSI(6), RSI(14), and RSI(24) with their default smoothing. Overbought/oversold fill zones are enabled by default.
Customizing RSI Periods: Adjust the RSI lengths (6, 14, 24) based on your trading timeframe. Shorter periods (6) for scalping, standard (14) for day trading, longer (24) for swing trading. You can disable any RSI period you don't need.
Smoothing Selection: Choose smoothing method based on your needs. EMA provides balanced smoothing, RMA (Wilder's) is traditional, Zero-Lag reduces lag but may increase noise. Adjust smoothing lengths individually or use global smoothing for consistency. Note: Smoothing lengths are automatically validated to ensure they are always less than the corresponding RSI period length. If you set smoothing >= RSI length, it will be auto-adjusted to prevent invalid configurations.
Dynamic OB/OS: The dynamic thresholds automatically adapt to volatility. Adjust the volatility multiplier and base percentage to fine-tune sensitivity. Higher values create wider thresholds in volatile markets.
Volume Confirmation: Set volume threshold to 1.2 (default) for standard confirmation, higher for stricter filtering, or 0.1 to disable volume filtering entirely.
Multi-RSI Synergy: Use "ALL" mode for highest-quality signals (all 3 RSIs must align), or "2-of-3" mode for more frequent signals. Adjust the reset period to control signal frequency.
Filters: Enable filters gradually to find your preferred balance. Start with volume confirmation, then add trend filter, then ADX for strongest confirmation. RSI(50) filter is useful for momentum-based strategies and is recommended for noise reduction. Momentum confirmation and multi-timeframe confirmation add additional layers of accuracy but may reduce signal frequency.
Noise Reduction: The noise reduction system is enabled by default with balanced settings. Adjust minSignalStrength (default 3.0) to control how far RSI must be from centerline. Increase requireConsecutiveBars (default 1) to require signals to persist longer. Enable requireZonePersistence and requireRsiSlope for stricter filtering (higher quality but fewer signals). Start with defaults and adjust based on your needs.
Divergence: Enable divergence detection and adjust lookback periods. Strong divergence (with engulfing confirmation) provides higher-quality signals. Hidden divergence is useful for trend-following strategies. Enable pivot-based divergence for more accurate detection using actual pivot points instead of simple lowest/highest comparisons. Pivot-based divergence uses tolerance-based matching (1% for price, 1.0 RSI point for RSI) for better accuracy.
Forecasting: Enable regression forecasting to see potential RSI direction. Linear regression is simplest, polynomial captures curves, exponential smoothing adapts to trends. Adjust horizon based on your trading timeframe. Confidence bands show forecast uncertainty - wider bands indicate less reliable forecasts.
Pivot Trendlines: Enable pivot trendlines to visualize RSI trends and identify trend breaks. Adjust pivot detection period (default 5) - higher values detect fewer but stronger pivots. Enable pivot confirmation (default ON) to reduce repainting. Set minPivotStrength (default 1.0) to filter weak pivots - lower values detect more pivots (more trendlines), higher values detect only stronger pivots (fewer trendlines). Enable "Keep Historical Trendlines" to preserve multiple trendlines instead of just the most recent one. Set "Max Trendlines to Keep" (default 5) to control how many historical trendlines are preserved. Enable trend break confirmation for more reliable break signals. Adjust minTrendlineAngle (default 0.0) to filter flat trendlines - set to 0.1-0.5 to exclude weak trendlines.
Alerts: Set up alerts for your preferred signal types. Enable cooldown to prevent alert spam. Each signal type has its own alert condition, so you can be selective about which signals trigger alerts.
Visual Elements and Signal Markers
The script uses various visual markers to indicate signals and conditions:
- "sBottom" label (green): Strong bottom signal - RSI at extreme low with strong buy conditions
- "sTop" label (red): Strong top signal - RSI at extreme high with strong sell conditions
- "SyBuy" label (lime): Multi-RSI synergy buy signal - all RSIs aligned oversold
- "SySell" label (red): Multi-RSI synergy sell signal - all RSIs aligned overbought
- 🐂 emoji (green): Strong bullish divergence detected
- 🐻 emoji (red): Strong bearish divergence detected
- 🔆 emoji: Weak divergence signals (if enabled)
- "H-Bull" label: Hidden bullish divergence
- "H-Bear" label: Hidden bearish divergence
- ⚡ marker (top of pane): Volume climax detected (extreme volume) - positioned at top for visibility
- 💧 marker (top of pane): Volume dry-up detected (very low volume) - positioned at top for visibility
- ↑ triangle (lime): Uptrend break signal - RSI breaks below uptrend line
- ↓ triangle (red): Downtrend break signal - RSI breaks above downtrend line
- Triangle up (lime): RSI(50) bullish crossover
- Triangle down (red): RSI(50) bearish crossover
- Circle markers: RSI period crossovers
All markers are positioned at the RSI value where the signal occurs, using location.absolute for precise placement.
Signal Priority and Interpretation
Signals are generated independently and can occur simultaneously. Higher-priority signals generally indicate stronger setups:
1. Multi-RSI Synergy signals (SyBuy/SySell) - Highest priority: Requires alignment across all RSI periods plus volume and filter confirmation. These are the most reliable signals.
2. Strong Top/Bottom signals (sTop/sBottom) - High priority: Indicates extreme RSI levels with strong bounce conditions. Requires volume confirmation and all filters.
3. Divergence signals - Medium-High priority: Strong divergence (with engulfing) is more reliable than regular divergence. Hidden divergence indicates continuation rather than reversal.
4. Adaptive RSI crossovers - Medium priority: Buy when adaptive RSI crosses below dynamic oversold, sell when it crosses above dynamic overbought. These use volatility-adjusted RSI for more accurate signals.
5. RSI(50) centerline crossovers - Medium priority: Momentum shift signals. Less reliable alone but useful when combined with other confirmations.
6. RSI period crossovers - Lower priority: Early momentum shift indicators. Can provide early warning but may produce false signals in choppy markets.
Best practice: Wait for multiple confirmations. For example, a synergy signal combined with divergence and volume climax provides the strongest setup.
Chart Requirements
For proper script functionality and compliance with TradingView requirements, ensure your chart displays:
- Symbol name: The trading pair or instrument name should be visible
- Timeframe: The chart timeframe should be clearly displayed
- Script name: "Ultimate RSI " should be visible in the indicator title
These elements help traders understand what they're viewing and ensure proper script identification. The script automatically includes this information in the indicator title and chart labels.
Performance Considerations
The script is optimized for performance:
- ATR and Volume SMA are cached using var variables, updating only on confirmed and real-time bars to reduce redundant calculations
- Forecast line arrays are dynamically managed: lines are reused when possible, and unused lines are deleted to prevent memory accumulation
- Calculations use efficient Pine Script functions (ta.rsi, ta.ema, etc.) which are optimized by TradingView
- Array operations are minimized where possible, with direct calculations preferred
- Polynomial regression automatically caps the forecast horizon at 20 bars (POLYNOMIAL_MAX_HORIZON constant) to prevent performance degradation, as polynomial regression has O(n³) complexity. This safeguard ensures optimal performance even with large horizon settings
- Pivot detection includes edge case handling to ensure reliable calculations even on early bars with limited historical data. Regression forecasting functions include comprehensive safety checks: horizon validation (must not exceed array size), empty array handling, edge case handling for horizon=1 scenarios, and division-by-zero protection in all mathematical operations
The script should perform well on all timeframes. On very long historical data, forecast lines may accumulate if the horizon is large; consider reducing the forecast horizon if you experience performance issues. The polynomial regression performance safeguard automatically prevents performance issues for that specific regression type.
Known Limitations and Considerations
- Forecast lines are forward-looking projections and should not be used as definitive predictions. They provide context but are not guaranteed to be accurate.
- Dynamic OB/OS thresholds can exceed 100 or go below 0 in extreme volatility scenarios, but are clamped to 0-100 range. This means in very volatile markets, the dynamic thresholds may not widen as much as the raw calculation suggests.
- Volume confirmation requires sufficient historical volume data. On new instruments or very short timeframes, volume calculations may be less reliable.
- Higher timeframe RSI uses request.security() which may have slight delays on some data feeds.
- Regression forecasting requires at least N bars of history (where N = forecast horizon) before it can generate forecasts. Early bars will not show forecast lines.
- StochRSI calculation requires the selected RSI source to have sufficient history. Very short RSI periods on new charts may produce less reliable StochRSI values initially.
Practical Use Cases
The indicator can be configured for different trading styles and timeframes:
Swing Trading: Select the "Swing Trading" preset for instant optimal configuration. This preset uses RSI periods (14, 14, 21) with moderate smoothing. Alternatively, manually configure: Use RSI(24) with Multi-RSI Synergy in "ALL" mode, combined with trend filter (EMA 200) and ADX filter. This configuration provides high-probability setups with strong confirmation across multiple RSI periods.
Day Trading: Select the "Day Trading" preset for instant optimal configuration. This preset uses RSI periods (6, 9, 14) with light smoothing and momentum confirmation enabled. Alternatively, manually configure: Use RSI(6) with Zero-Lag smoothing for fast signal detection. Enable volume confirmation with threshold 1.2-1.5 for reliable entries. Combine with RSI(50) filter to ensure momentum alignment. Strong top/bottom signals work well for day trading reversals.
Trend Following: Enable trend filter (EMA) and EMA slope filter for strong trend confirmation. Use RSI(14) or RSI(24) with ADX filter to avoid choppy markets. Hidden divergence signals are useful for trend continuation entries.
Reversal Trading: Focus on divergence detection (regular and strong) combined with strong top/bottom signals. Enable volume climax detection to identify capitulation moments. Use RSI(6) for early reversal signals, confirmed by RSI(14) and RSI(24).
Forecasting and Planning: Enable regression forecasting with polynomial or exponential smoothing methods. Use forecast horizon of 10-20 bars for swing trading, 5-10 bars for day trading. Confidence bands help assess forecast reliability.
Multi-Timeframe Analysis: Enable higher timeframe RSI to see context from larger timeframes. For example, use daily RSI on hourly charts to understand the larger trend context. This helps avoid counter-trend trades.
Scalping: Select the "Scalping" preset for instant optimal configuration. This preset uses RSI periods (4, 7, 9) with minimal smoothing, disables noise reduction, and disables momentum confirmation for faster signals. Alternatively, manually configure: Use RSI(6) with minimal smoothing (or Zero-Lag) for ultra-fast signals. Disable most filters except volume confirmation. Use RSI period crossovers (RSI(6) × RSI(14)) for early momentum shifts. Set volume threshold to 1.0-1.2 for less restrictive filtering.
Position Trading: Select the "Position Trading" preset for instant optimal configuration. This preset uses extended RSI periods (24, 21, 28) with heavier smoothing, optimized for longer-term trades. Alternatively, manually configure: Use RSI(24) with all filters enabled (Trend, ADX, RSI(50), Volume Dry-Up avoidance). Multi-RSI Synergy in "ALL" mode provides highest-quality signals.
Practical Tips and Best Practices
Getting Started: The fastest way to get started is to select a configuration preset that matches your trading style. Simply choose "Scalping", "Day Trading", "Swing Trading", or "Position Trading" from the "Configuration Preset" dropdown to instantly configure all settings optimally. For advanced users, use "Custom" mode for full manual control. The default configuration (Custom mode) is balanced and works well across different markets. After observing behavior, customize settings to match your trading style.
Reducing Repainting: All signals are based on confirmed bars, minimizing repainting. The script uses confirmed bar data for all calculations to ensure backtesting accuracy.
Signal Quality: Multi-RSI Synergy signals in "ALL" mode provide the highest-quality signals because they require alignment across all three RSI periods. These signals have lower frequency but higher reliability. For more frequent signals, use "2-of-3" mode. The noise reduction system further improves signal quality by requiring multiple confirmations (signal strength, extreme zone, consecutive bars, optional zone persistence and RSI slope). Adjust noise reduction settings to balance signal frequency vs. accuracy.
Filter Combinations: Start with volume confirmation, then add trend filter for trend alignment, then ADX filter for trend strength. Combining all three filters significantly reduces false signals but also reduces signal frequency. Find your balance based on your risk tolerance.
Volume Filtering: Set volume threshold to 0.1 or lower to effectively disable volume filtering if you trade instruments with unreliable volume data or want to test without volume confirmation. Standard confirmation uses 1.2-1.5 threshold.
RSI Period Selection: RSI(6) is most sensitive and best for scalping or early signal detection. RSI(14) provides balanced signals suitable for day trading. RSI(24) is smoother and better for swing trading and trend confirmation. You can disable any RSI period you don't need to reduce visual clutter.
Smoothing Methods: EMA provides balanced smoothing with moderate lag. RMA (Wilder's smoothing) is traditional and works well for RSI. Zero-Lag reduces lag but may increase noise. WMA gives more weight to recent values. Choose based on your preference for responsiveness vs. smoothness.
Forecasting: Linear regression is simplest and works well for trending markets. Polynomial regression captures curves and works better in ranging markets. Exponential smoothing adapts to trends. Moving average method is most conservative. Use confidence bands to assess forecast reliability.
Divergence: Strong divergence (with engulfing confirmation) is more reliable than regular divergence. Hidden divergence indicates continuation rather than reversal, useful for trend-following strategies. Pivot-based divergence provides more accurate detection by using actual pivot points instead of simple lowest/highest comparisons. Adjust lookback periods based on your timeframe: shorter for day trading, longer for swing trading. Pivot divergence period (default 5) controls the sensitivity of pivot detection.
Dynamic Thresholds: Dynamic OB/OS thresholds automatically adapt to volatility. In volatile markets, thresholds widen; in calm markets, they narrow. Adjust the volatility multiplier and base percentage to fine-tune sensitivity. Higher values create wider thresholds in volatile markets.
Alert Management: Enable alert cooldown (default 10 bars, recommended) to prevent alert spam. Each alert type has its own cooldown, so you can set different cooldowns for different signal types. For example, use shorter cooldown for synergy signals (high quality) and longer cooldown for crossovers (more frequent). The cooldown system works independently for each signal type, preventing spam while allowing different signal types to fire when appropriate.
Technical Specifications
- Pine Script Version: v6
- Indicator Type: Non-overlay (displays in separate panel below price chart)
- Repainting Behavior: Minimal - all signals are based on confirmed bars, ensuring accurate backtesting results
- Performance: Optimized with caching for ATR and volume calculations. Forecast arrays are dynamically managed to prevent memory accumulation.
- Compatibility: Works on all timeframes (1 minute to 1 month) and all instruments (stocks, forex, crypto, futures, etc.)
- Edge Case Handling: All calculations include safety checks for division by zero, NA values, and boundary conditions. Reset conditions and alert cooldowns handle edge cases where conditions never occurred or values are NA.
- Reset Logic: Separate reset conditions for buy signals (based on bottom conditions) and sell signals (based on top conditions) ensure logical correctness.
- Input Parameters: 60+ customizable parameters organized into logical groups for easy configuration. Configuration presets available for instant setup (Scalping, Day Trading, Swing Trading, Position Trading, Custom).
- Noise Reduction: Comprehensive noise reduction system with multiple filters (signal strength, extreme zone, consecutive bars, zone persistence, RSI slope) to reduce false signals.
- Pivot-Based Divergence: Enhanced divergence detection using actual pivot points for improved accuracy.
- Momentum Confirmation: RSI momentum filter ensures signals only fire when RSI is accelerating in the signal direction.
- Multi-Timeframe Confirmation: Optional higher timeframe RSI alignment for trend confirmation.
- Enhanced Pivot Trendlines: Trendline drawing with strength requirements, confirmation, and trend break detection.
Technical Notes
- All RSI values are clamped to 0-100 range to ensure valid oscillator values
- ATR and Volume SMA are cached for performance, updating on confirmed and real-time bars
- Reset conditions handle edge cases: if a condition never occurred, reset returns true (allows first signal)
- Alert cooldown handles na values: if no previous alert, cooldown allows the alert
- Forecast arrays are dynamically sized based on horizon, with unused lines cleaned up
- Fill logic uses a minimum gap (0.1) to ensure reliable polygon rendering in TradingView
- All calculations include safety checks for division by zero and boundary conditions. Regression functions validate that horizon doesn't exceed array size, and all array access operations include bounds checking to prevent out-of-bounds errors
- The script uses separate reset conditions for buy signals (based on bottom conditions) and sell signals (based on top conditions) for logical correctness
- Background coloring uses a fallback system: dynamic color takes priority, then RSI(6) heatmap, then monotone if both are disabled
- Noise reduction filters are applied after accuracy filters, providing multiple layers of signal quality control
- Pivot trendlines use strength requirements to filter weak pivots, reducing noise in trendline drawing. Historical trendlines are stored in arrays and automatically limited to prevent memory accumulation when "Keep Historical Trendlines" is enabled
- Volume climax and dry-up markers are positioned at the top of the pane for better visibility
- All calculations are optimized with conditional execution - features only calculate when enabled (performance optimization)
- Input Validation: Automatic cross-input validation ensures smoothing lengths are always less than RSI period lengths, preventing configuration errors
- Configuration Presets: Four optimized preset configurations (Scalping, Day Trading, Swing Trading, Position Trading) for instant setup, plus Custom mode for full manual control
- Constants Management: Magic numbers extracted to documented constants for improved maintainability and easier tuning (pivot tolerance, divergence thresholds, fill gap, etc.)
- TradingView Function Consistency: All TradingView functions (ta.crossover, ta.crossunder, ta.atr, ta.lowest, ta.highest, ta.lowestbars, ta.highestbars, etc.) and custom functions that depend on historical results (f_consecutiveBarConfirmation, f_rsiSlopeConfirmation, f_rsiZonePersistence, f_applyAllFilters, f_rsiMomentum, f_forecast, f_confirmPivotLow, f_confirmPivotHigh) are called on every bar for consistency, as recommended by TradingView. Results are then used conditionally when needed. This ensures consistent calculations and prevents calculation inconsistencies.

Luxy Super-Duper SuperTrend Predictor Engine and Buy/Sell signalA professional trend-following grading system that analyzes historical trend
patterns to provide statistical duration estimates using advanced similarity
matching and k-nearest neighbors analysis. Combines adaptive Supertrend with
intelligent duration statistics, multi-timeframe confluence, volume confirmation,
and quality scoring to identify high-probability setups with data-driven
target ranges across all timeframes.
Note: All duration estimates are statistical calculations based on historical data, not guarantees of future performance.
WHAT MAKES THIS DIFFERENT
Unlike traditional SuperTrend indicators that only tell you trend direction, this system answers the critical question: "What is the typical duration for trends like this?"
The Statistical Analysis Engine:
• Analyzes your chart's last 15+ completed SuperTrend trends (bullish and bearish separately)
• Uses k-nearest neighbors similarity matching to find historically similar setups
• Calculates statistical duration estimates based on current market conditions
• Learns from estimation errors and adapts over time (Advanced mode)
• Displays visual duration analysis box showing median, average, and range estimates
• Tracks Statistical accuracy with backtest statistics
Complete Trading System:
• Statistical trend duration analysis with three intelligence levels
• Adaptive Supertrend with dynamic ATR-based bands
• Multi-timeframe confluence analysis (6 timeframes: 5M to 1W)
• Volume confirmation with spike detection and momentum tracking
• Quality scoring system (0-70 points) rating each setup
• One-click preset optimization for all trading styles
• Anti-repaint guarantee on all signals and duration estimates
METHODOLOGY CREDITS
This indicator's approach is inspired by proven trading methodologies from respected market educators:
• Mark Minervini - Volatility Contraction Pattern (VCP) and pullback entry techniques
• William O'Neil - Volume confirmation principles and institutional buying patterns (CANSLIM methodology)
• Dan Zanger - Volatility expansion entries and momentum breakout strategies
Important: These are educational references only. This indicator does not guarantee any specific trading results. Always conduct your own analysis and risk management.
KEY FEATURES
1. TREND DURATION ANALYSIS SYSTEM - The Core Innovation
The statistical analysis engine is what sets this indicator apart from standard SuperTrend systems. It doesn't just identify trend changes - it provides statistical analysis of potential duration.
How It Works:
Step 1: Historical Tracking
• Automatically records every completed SuperTrend trend (duration in bars)
• Maintains separate databases for bullish trends and bearish trends
• Stores up to 15 most recent trends of each type
• Captures market conditions at each trend flip: volume ratio, ATR ratio, quality score, price distance from SuperTrend, proximity to support/resistance
Step 2: Similarity Matching (k-Nearest Neighbors)
• When new trend begins, system compares current conditions to ALL historical flips
• Calculates similarity score based on:
- Volume similarity (30% weight) - Is volume behaving similarly?
- Volatility similarity (30% weight) - Is ATR/volatility similar?
- Quality similarity (20% weight) - Is setup strength comparable?
- Distance similarity (10% weight) - Is price distance from ST similar?
- Support/Resistance proximity (10% weight) - Similar structural context?
• Selects the 15 MOST SIMILAR historical trends (not just all trends)
• This is like asking: "When conditions looked like this before, how long did trends last?"
Step 3: Statistical Analysis
• Calculates median duration (most common outcome)
• Calculates average duration (mean of similar trends)
• Determines realistic range (min to max of similar trends)
• Applies exponential weighting (recent trends weighted more heavily)
• Outputs confidence-weighted statistical estimate
Step 4: Advanced Intelligence (Advanced Mode Only)
The Advanced mode applies five sophisticated multipliers to refine estimates:
A) Market Structure Multiplier (±30%):
• Detects nearby support/resistance levels using pivot detection
• If flip occurs NEAR a key level: Estimate adjusted -30% (expect bounce/rejection)
• If flip occurs in open space: Estimate adjusted +30% (clear path for continuation)
• Uses configurable lookback period and ATR-based proximity threshold
B) Asset Type Multiplier (±40%):
• Adjusts duration estimates based on asset volatility characteristics
• Small Cap / Biotech: +40% (explosive, extended moves)
• Tech Growth: +20% (momentum-driven, longer trends)
• Blue Chip / Large Cap: 0% (baseline, steady trends)
• Dividend / Value: -20% (slower, grinding trends)
• Cyclical: Variable based on macro regime
• Crypto / High Volatility: +30% (parabolic potential)
C) Flip Strength Multiplier (±20%):
• Analyzes the QUALITY of the trend flip itself
• Strong flip (high volume + expanding ATR + quality score 60+): +20%
• Weak flip (low volume + contracting ATR + quality score under 40): -20%
• Logic: Historical data shows that powerful flips tend to be followed by longer trends
D) Error Learning Multiplier (±15%):
• Tracks Statistical accuracy over last 10 completed trends
• Calculates error ratio: (estimated duration / Actual Duration)
• If system consistently over-estimates: Apply -15% correction
• If system consistently under-estimates: Apply +15% correction
• Learns and adapts to current market regime
E) Regime Detection Multiplier (±20%):
• Analyzes last 3 trends of SAME TYPE (bull-to-bull or bear-to-bear)
• Compares recent trend durations to historical average
• If recent trends 20%+ longer than average: +20% adjustment (trending regime detected)
• If recent trends 20%+ shorter than average: -20% adjustment (choppy regime detected)
• Detects whether market is in trending or mean-reversion mode
Three analysis modes:
SIMPLE MODE - Basic Statistics
• Uses raw median of similar trends only
• No multipliers, no adjustments
• Best for: Beginners, clean trending markets
• Fastest calculations, minimal complexity
STANDARD MODE - Full Statistical Analysis
• Similarity matching with k-nearest neighbors
• Exponential weighting of recent trends
• Median, average, and range calculations
• Best for: Most traders, general market conditions
• Balance of accuracy and simplicity
ADVANCED MODE - Statistics + Intelligence
• Everything in Standard mode PLUS
• All 5 advanced multipliers (structure, asset type, flip strength, learning, regime)
• Highest Statistical accuracy in testing
• Best for: Experienced traders, volatile/complex markets
• Maximum intelligence, most adaptive
Visual Duration Analysis Box:
When a new trend begins (SuperTrend flip), a box appears on your chart showing:
• Analysis Mode (Simple / Standard / Advanced)
• Number of historical trends analyzed
• Median expected duration (most likely outcome)
• Average expected duration (mean of similar trends)
• Range (minimum to maximum from similar trends)
• Advanced multipliers breakdown (Advanced mode only)
• Backtest accuracy statistics (if available)
The box extends from the flip bar to the estimated endpoint based on historical data, giving you a visual target for trend duration. Box updates in real-time as trend progresses.
Backtest & Accuracy Tracking:
• System backtests its own duration estimates using historical data
• Shows accuracy metrics: how well duration estimates matched actual durations
• Tracks last 10 completed duration estimates separately
• Displays statistics in dashboard and duration analysis boxes
• Helps you understand statistical reliability on your specific symbol/timeframe
Anti-Repaint Guarantee:
• duration analysis boxes only appear AFTER bar close (barstate.isconfirmed)
• Historical duration estimates never disappear or change
• What you see in history is exactly what you would have seen real-time
• No future data leakage, no lookahead bias
2. INTELLIGENT PRESET CONFIGURATIONS - One-Click Optimization
Unlike indicators that require tedious parameter tweaking, this system includes professionally optimized presets for every trading style. Select your approach from the dropdown and ALL parameters auto-configure.
"AUTO (DETECT FROM TF)" - RECOMMENDED
The smartest option: automatically selects optimal settings based on your chart timeframe.
• 1m-5m charts → Scalping preset (ATR: 7, Mult: 2.0)
• 15m-1h charts → Day Trading preset (ATR: 10, Mult: 2.5)
• 2h-4h-D charts → Swing Trading preset (ATR: 14, Mult: 3.0)
• W-M charts → Position Trading preset (ATR: 21, Mult: 4.0)
Benefits:
• Zero configuration - works immediately
• Always matched to your timeframe
• Switch timeframe = automatic adjustment
• Perfect for traders who use multiple timeframes
"SCALPING (1-5M)" - Ultra-Fast Signals
Optimized for: 1-5 minute charts, high-frequency trading, quick profits
Target holding period: Minutes to 1-2 hours maximum
Best markets: High-volume stocks, major crypto pairs, active futures
Parameter Configuration:
• Supertrend: ATR 7, Multiplier 2.0 (very sensitive)
• Volume: MA 10, High 1.8x, Spike 3.0x (catches quick surges)
• Volume Momentum: AUTO-DISABLED (too restrictive for fast scalping)
• Quality minimum: 40 points (accepts more setups)
• Duration Analysis: Uses last 15 trends with heavy recent weighting
Trading Logic:
Speed over precision. Short ATR period and low multiplier create highly responsive SuperTrend. Volume momentum filter disabled to avoid missing fast moves. Quality threshold relaxed to catch more opportunities in rapid market conditions.
Signals per session: 5-15 typically
Hold time: Minutes to couple hours
Best for: Active traders with fast execution
"DAY TRADING (15M-1H)" - Balanced Approach
Optimized for: 15-minute to 1-hour charts, intraday moves, session-based trading
Target holding period: 30 minutes to 8 hours (within trading day)
Best markets: Large-cap stocks, major indices, established crypto
Parameter Configuration:
• Supertrend: ATR 10, Multiplier 2.5 (balanced)
• Volume: MA 20, High 1.5x, Spike 2.5x (standard detection)
• Volume Momentum: 5/20 periods (confirms intraday strength)
• Quality minimum: 50 points (good setups preferred)
• Duration Analysis: Balanced weighting of recent vs historical
Trading Logic:
The most balanced configuration. ATR 10 with multiplier 2.5 provides steady trend following that avoids noise while catching meaningful moves. Volume momentum confirms institutional participation without being overly restrictive.
Signals per session: 2-5 typically
Hold time: 30 minutes to full day
Best for: Part-time and full-time active traders
"SWING TRADING (4H-D)" - Trend Stability
Optimized for: 4-hour to Daily charts, multi-day holds, trend continuation
Target holding period: 2-15 days typically
Best markets: Growth stocks, sector ETFs, trending crypto, commodity futures
Parameter Configuration:
• Supertrend: ATR 14, Multiplier 3.0 (stable)
• Volume: MA 30, High 1.3x, Spike 2.2x (accumulation focus)
• Volume Momentum: 10/30 periods (trend stability)
• Quality minimum: 60 points (high-quality setups only)
• Duration Analysis: Favors consistent historical patterns
Trading Logic:
Designed for substantial trend moves while filtering short-term noise. Higher ATR period and multiplier create stable SuperTrend that won't flip on minor corrections. Stricter quality requirements ensure only strongest setups generate signals.
Signals per week: 2-5 typically
Hold time: Days to couple weeks
Best for: Part-time traders, swing style
"POSITION TRADING (D-W)" - Long-Term Trends
Optimized for: Daily to Weekly charts, major trend changes, portfolio allocation
Target holding period: Weeks to months
Best markets: Blue-chip stocks, major indices, established cryptocurrencies
Parameter Configuration:
• Supertrend: ATR 21, Multiplier 4.0 (very stable)
• Volume: MA 50, High 1.2x, Spike 2.0x (long-term accumulation)
• Volume Momentum: 20/50 periods (major trend confirmation)
• Quality minimum: 70 points (excellent setups only)
• Duration Analysis: Heavy emphasis on multi-year historical data
Trading Logic:
Conservative approach focusing on major trend changes. Extended ATR period and high multiplier create SuperTrend that only flips on significant reversals. Very strict quality filters ensure signals represent genuine long-term opportunities.
Signals per month: 1-2 typically
Hold time: Weeks to months
Best for: Long-term investors, set-and-forget approach
"CUSTOM" - Advanced Configuration
Purpose: Complete manual control for experienced traders
Use when: You understand the parameters and want specific optimization
Best for: Testing new approaches, unusual market conditions, specific instruments
Full control over:
• All SuperTrend parameters
• Volume thresholds and momentum periods
• Quality scoring weights
• analysis mode and multipliers
• Advanced features tuning
Preset Comparison Quick Reference:
Chart Timeframe: Scalping (1M-5M) | Day Trading (15M-1H) | Swing (4H-D) | Position (D-W)
Signals Frequency: Very High | High | Medium | Low
Hold Duration: Minutes | Hours | Days | Weeks-Months
Quality Threshold: 40 pts | 50 pts | 60 pts | 70 pts
ATR Sensitivity: Highest | Medium | Lower | Lowest
Time Investment: Highest | High | Medium | Lowest
Experience Level: Expert | Advanced | Intermediate | Beginner+
3. QUALITY SCORING SYSTEM (0-70 Points)
Every signal is rated in real-time across three dimensions:
Volume Confirmation (0-30 points):
• Volume Spike (2.5x+ average): 30 points
• High Volume (1.5x+ average): 20 points
• Above Average (1.0x+ average): 10 points
• Below Average: 0 points
Volatility Assessment (0-30 points):
• Expanding ATR (1.2x+ average): 30 points
• Rising ATR (1.0-1.2x average): 15 points
• Contracting/Stable ATR: 0 points
Volume Momentum (0-10 points):
• Strong Momentum (1.2x+ ratio): 10 points
• Rising Momentum (1.0-1.2x ratio): 5 points
• Weak/Neutral Momentum: 0 points
Score Interpretation:
60-70 points - EXCELLENT:
• All factors aligned
• High conviction setup
• Maximum position size (within risk limits)
• Primary trading opportunities
45-59 points - STRONG:
• Multiple confirmations present
• Above-average setup quality
• Standard position size
• Good trading opportunities
30-44 points - GOOD:
• Basic confirmations met
• Acceptable setup quality
• Reduced position size
• Wait for additional confirmation or trade smaller
Below 30 points - WEAK:
• Minimal confirmations
• Low probability setup
• Consider passing
• Only for aggressive traders in strong trends
Only signals meeting your minimum quality threshold (configurable per preset) generate alerts and labels.
4. MULTI-TIMEFRAME CONFLUENCE ANALYSIS
The system can simultaneously analyze trend alignment across 6 timeframes (optional feature):
Timeframes analyzed:
• 5-minute (scalping context)
• 15-minute (intraday momentum)
• 1-hour (day trading bias)
• 4-hour (swing context)
• Daily (primary trend)
• Weekly (macro trend)
Confluence Interpretation:
• 5-6/6 aligned - Very strong multi-timeframe agreement (highest confidence)
• 3-4/6 aligned - Moderate agreement (standard setup)
• 1-2/6 aligned - Weak agreement (caution advised)
Dashboard shows real-time alignment count with color-coding. Higher confluence typically correlates with longer, stronger trends.
5. VOLUME MOMENTUM FILTER - Institutional Money Flow
Unlike traditional volume indicators that just measure size, Volume Momentum tracks the RATE OF CHANGE in volume:
How it works:
• Compares short-term volume average (fast period) to long-term average (slow period)
• Ratio above 1.0 = Volume accelerating (money flowing IN)
• Ratio above 1.2 = Strong acceleration (institutional participation likely)
• Ratio below 0.8 = Volume decelerating (money flowing OUT)
Why it matters:
• Confirms trend with actual money flow, not just price
• Leading indicator (volume often leads price)
• Catches accumulation/distribution before breakouts
• More intuitive than complex mathematical filters
Integration with signals:
• Optional filter - can be enabled/disabled per preset
• When enabled: Only signals with rising volume momentum fire
• AUTO-DISABLED in Scalping mode (too restrictive for fast trading)
• Configurable fast/slow periods per trading style
6. ADAPTIVE SUPERTREND MULTIPLIER
Traditional SuperTrend uses fixed ATR multiplier. This system dynamically adjusts the multiplier (0.8x to 1.2x base) based on:
• Trend Strength: Price correlation over lookback period
• Volume Weight: Current volume relative to average
Benefits:
• Tighter bands in calm markets (less premature exits)
• Wider bands in volatile conditions (avoids whipsaws)
• Better adaptation to biotech, small-cap, and crypto volatility
• Optional - can be disabled for classic constant multiplier
7. VISUAL GRADIENT RIBBON
26-layer exponential gradient fill between price and SuperTrend line provides instant visual trend strength assessment:
Color System:
• Green shades - Bullish trend + volume confirmation (strongest)
• Blue shades - Bullish trend, normal volume
• Orange shades - Bearish trend + volume confirmation
• Red shades - Bearish trend (weakest)
Opacity varies based on:
• Distance from SuperTrend (farther = more opaque)
• Volume intensity (higher volume = stronger color)
The ribbon provides at-a-glance trend strength without cluttering your chart. Can be toggled on/off.
8. INTELLIGENT ALERT SYSTEM
Two-tier alert architecture for flexibility:
Automatic Alerts:
• Fire automatically on BUY and SELL signals
• Include full context: quality score, volume state, volume momentum
• One alert per bar close (alert.freq_once_per_bar_close)
• Message format: "BUY: Supertrend bullish + Quality: 65/70 | Volume: HIGH | Vol Momentum: STRONG (1.35x)"
Customizable Alert Conditions:
• Appear in TradingView's "Create Alert" dialog
• Three options: BUY Signal Only, SELL Signal Only, ANY Signal (BUY or SELL)
• Use TradingView placeholders: {{ticker}}, {{interval}}, {{close}}, {{time}}
• Fully customizable message templates
All alerts use barstate.isconfirmed - Zero repaint guarantee.
9. ANTI-REPAINT ARCHITECTURE
Every component guaranteed non-repainting:
• Entry signals: Only appear after bar close
• duration analysis boxes: Created only on confirmed SuperTrend flips
• Informative labels: Wait for bar confirmation
• Alerts: Fire once per closed bar
• Multi-timeframe data: Uses lookahead=barmerge.lookahead_off
What you see in history is exactly what you would have seen in real-time. No disappearing signals, no changed duration estimates.
HOW TO USE THE INDICATOR
QUICK START - 3 Steps to Trading:
Step 1: Select Your Trading Style
Open indicator settings → "Quick Setup" section → Trading Style Preset dropdown
Options:
• Auto (Detect from TF) - RECOMMENDED: Automatically configures based on your chart timeframe
• Scalping (1-5m) - For 1-5 minute charts, ultra-fast signals
• Day Trading (15m-1h) - For 15m-1h charts, balanced approach
• Swing Trading (4h-D) - For 4h-Daily charts, trend stability
• Position Trading (D-W) - For Daily-Weekly charts, long-term trends
• Custom - Manual configuration (advanced users only)
Choose "Auto" and you're done - all parameters optimize automatically.
Step 2: Understand the Signals
BUY Signal (Green Triangle Below Price):
• SuperTrend flipped bullish
• Quality score meets minimum threshold (varies by preset)
• Volume confirmation present (if filter enabled)
• Volume momentum rising (if filter enabled)
• duration analysis box shows expected trend duration
SELL Signal (Red Triangle Above Price):
• SuperTrend flipped bearish
• Quality score meets minimum threshold
• Volume confirmation present (if filter enabled)
• Volume momentum rising (if filter enabled)
• duration analysis box shows expected trend duration
Duration Analysis Box:
• Appears at SuperTrend flip (start of new trend)
• Shows median, average, and range duration estimates
• Extends to estimated endpoint based on historical data visually
• Updates mode-specific intelligence (Simple/Standard/Advanced)
Step 3: Use the Dashboard for Context
Dashboard (top-right corner) shows real-time metrics:
• Row 1 - Quality Score: Current setup rating (0-70)
• Row 2 - SuperTrend: Direction and current level
• Row 3 - Volume: Status (Spike/High/Normal/Low) with color
• Row 4 - Volatility: State (Expanding/Rising/Stable/Contracting)
• Row 5 - Volume Momentum: Ratio and trend
• Row 6 - Duration Statistics: Accuracy metrics and track record
Every cell has detailed tooltip - hover for full explanations.
SIGNAL INTERPRETATION BY QUALITY SCORE:
Excellent Setup (60-70 points):
• Quality Score: 60-70
• Volume: Spike or High
• Volatility: Expanding
• Volume Momentum: Strong (1.2x+)
• MTF Confluence (if enabled): 5-6/6
• Action: Primary trade - maximum position size (within risk limits)
• Statistical reliability: Highest - duration estimates most accurate
Strong Setup (45-59 points):
• Quality Score: 45-59
• Volume: High or Above Average
• Volatility: Rising
• Volume Momentum: Rising (1.0-1.2x)
• MTF Confluence (if enabled): 3-4/6
• Action: Standard trade - normal position size
• Statistical reliability: Good - duration estimates reliable
Good Setup (30-44 points):
• Quality Score: 30-44
• Volume: Above Average
• Volatility: Stable or Rising
• Volume Momentum: Neutral to Rising
• MTF Confluence (if enabled): 3-4/6
• Action: Cautious trade - reduced position size, wait for additional confirmation
• Statistical reliability: Moderate - duration estimates less certain
Weak Setup (Below 30 points):
• Quality Score: Below 30
• Volume: Low or Normal
• Volatility: Contracting or Stable
• Volume Momentum: Weak
• MTF Confluence (if enabled): 1-2/6
• Action: Pass or wait for improvement
• Statistical reliability: Low - duration estimates unreliable
USING duration analysis boxES FOR TRADE MANAGEMENT:
Entry Timing:
• Enter on SuperTrend flip (signal bar close)
• duration analysis box appears simultaneously
• Note the median duration - this is your expected hold time
Profit Targets:
• Conservative: Use MEDIAN duration as profit target (50% probability)
• Moderate: Use AVERAGE duration (mean of similar trends)
• Aggressive: Aim for MAX duration from range (best historical outcome)
Position Management:
• Scale out at median duration (take partial profits)
• Trail stop as trend extends beyond median
• Full exit at average duration or SuperTrend flip (whichever comes first)
• Re-evaluate if trend exceeds estimated range
analysis mode Selection:
• Simple: Clean trending markets, beginners, minimal complexity
• Standard: Most markets, most traders (recommended default)
• Advanced: Volatile markets, complex instruments, experienced traders seeking highest accuracy
Asset Type Configuration (Advanced Mode):
If using Advanced analysis mode, configure Asset Type for optimal accuracy:
• Small Cap: Stocks under $2B market cap, low liquidity
• Biotech / Speculative: Clinical-stage pharma, penny stocks, high-risk
• Blue Chip / Large Cap: S&P 500, mega-cap tech, stable large companies
• Tech Growth: High-growth tech (TSLA, NVDA, growth SaaS)
• Dividend / Value: Dividend aristocrats, value stocks, utilities
• Cyclical: Energy, materials, industrials (macro-driven)
• Crypto / High Volatility: Bitcoin, altcoins, highly volatile assets
Correct asset type selection improves Statistical accuracy by 15-20%.
RISK MANAGEMENT GUIDELINES:
1. Stop Loss Placement:
Long positions:
• Place stop below recent swing low OR
• Place stop below SuperTrend level (whichever is tighter)
• Use 1-2 ATR distance as guideline
• Recommended: SuperTrend level (built-in volatility adjustment)
Short positions:
• Place stop above recent swing high OR
• Place stop above SuperTrend level (whichever is tighter)
• Use 1-2 ATR distance as guideline
• Recommended: SuperTrend level
2. Position Sizing by Quality Score:
• Excellent (60-70): Maximum position size (2% risk per trade)
• Strong (45-59): Standard position size (1.5% risk per trade)
• Good (30-44): Reduced position size (1% risk per trade)
• Weak (Below 30): Pass or micro position (0.5% risk - learning trades only)
3. Exit Strategy Options:
Option A - Statistical Duration-Based Exit:
• Exit at median estimated duration (conservative)
• Exit at average estimated duration (moderate)
• Trail stop beyond average duration (aggressive)
Option B - Signal-Based Exit:
• Exit on opposite signal (SELL after BUY, or vice versa)
• Exit on SuperTrend flip (trend reversal)
• Exit if quality score drops below 30 mid-trend
Option C - Hybrid (Recommended):
• Take 50% profit at median estimated duration
• Trail stop on remaining 50% using SuperTrend as trailing level
• Full exit on SuperTrend flip or quality collapse
4. Trade Filtering:
For higher win-rate (fewer trades, better quality):
• Increase minimum quality score (try 60 for swing, 50 for day trading)
• Enable volume momentum filter (ensure institutional participation)
• Require higher MTF confluence (5-6/6 alignment)
• Use Advanced analysis mode with appropriate asset type
For more opportunities (more trades, lower quality threshold):
• Decrease minimum quality score (40 for day trading, 35 for scalping)
• Disable volume momentum filter
• Lower MTF confluence requirement
• Use Simple or Standard analysis mode
SETTINGS OVERVIEW
Quick Setup Section:
• Trading Style Preset: Auto / Scalping / Day Trading / Swing / Position / Custom
Dashboard & Display:
• Show Dashboard (ON/OFF)
• Dashboard Position (9 options: Top/Middle/Bottom + Left/Center/Right)
• Text Size (Auto/Tiny/Small/Normal/Large/Huge)
• Show Ribbon Fill (ON/OFF)
• Show SuperTrend Line (ON/OFF)
• Bullish Color (default: Green)
• Bearish Color (default: Red)
• Show Entry Labels - BUY/SELL signals (ON/OFF)
• Show Info Labels - Volume events (ON/OFF)
• Label Size (Auto/Tiny/Small/Normal/Large/Huge)
Supertrend Configuration:
• ATR Length (default varies by preset: 7-21)
• ATR Multiplier Base (default varies by preset: 2.0-4.0)
• Use Adaptive Multiplier (ON/OFF) - Dynamic 0.8x-1.2x adjustment
• Smoothing Factor (0.0-0.5) - EMA smoothing applied to bands
• Neutral Bars After Flip (0-10) - Hide ST immediately after flip
Volume Momentum:
• Enable Volume Momentum Filter (ON/OFF)
• Fast Period (default varies by preset: 3-20)
• Slow Period (default varies by preset: 10-50)
Volume Analysis:
• Volume MA Length (default varies by preset: 10-50)
• High Volume Threshold (default: 1.5x)
• Spike Threshold (default: 2.5x)
• Low Volume Threshold (default: 0.7x)
Quality Filters:
• Minimum Quality Score (0-70, varies by preset)
• Require Volume Confirmation (ON/OFF)
Trend Duration Analysis:
• Show Duration Analysis (ON/OFF) - Display duration analysis boxes
• analysis mode - Simple / Standard / Advanced
• Asset Type - 7 options (Small Cap, Biotech, Blue Chip, Tech Growth, Dividend, Cyclical, Crypto)
• Use Exponential Weighting (ON/OFF) - Recent trends weighted more
• Decay Factor (0.5-0.99) - How much more recent trends matter
• Structure Lookback (3-30) - Pivot detection period for support/resistance
• Proximity Threshold (xATR) - How close to level qualifies as "near"
• Enable Error Learning (ON/OFF) - System learns from estimation errors
• Memory Depth (3-20) - How many past errors to remember
Box Visual Settings:
• duration analysis box Border Color
• duration analysis box Background Color
• duration analysis box Text Color
• duration analysis box Border Width
• duration analysis box Transparency
Multi-Timeframe (Optional Feature):
• Enable MTF Confluence (ON/OFF)
• Minimum Alignment Required (0-6)
• Individual timeframe enable/disable toggles
• Custom timeframe selection options
All preset configurations override manual inputs except when "Custom" is selected.
ADVANCED FEATURES
1. Scalpel Mode (Optional)
Advanced pullback entry system that waits for healthy retracements within established trends before signaling entry:
• Monitors price distance from SuperTrend levels
• Requires pullback to configurable range (default: 30-50%)
• Ensures trend remains intact before entry signal
• Reduces whipsaw and false breakouts
• Inspired by Mark Minervini's VCP pullback entries
Best for: Swing traders and day traders seeking precision entries
Scalpers: Consider disabling for faster entries
2. Error Learning System (Advanced analysis mode Only)
The system learns from its own estimation errors:
• Tracks last 10-20 completed duration estimates (configurable memory depth)
• Calculates error ratio for each: estimated duration / Actual Duration
• If system consistently over-estimates: Applies negative correction (-15%)
• If system consistently under-estimates: Applies positive correction (+15%)
• Adapts to current market regime automatically
This self-correction mechanism improves accuracy over time as the system gathers more data on your specific symbol and timeframe.
3. Regime Detection (Advanced analysis mode Only)
Automatically detects whether market is in trending or choppy regime:
• Compares last 3 trends to historical average
• Recent trends 20%+ longer → Trending regime (+20% to estimates)
• Recent trends 20%+ shorter → Choppy regime (-20% to estimates)
• Applied separately to bullish and bearish trends
Helps duration estimates adapt to changing market conditions without manual intervention.
4. Exponential Weighting
Option to weight recent trends more heavily than distant history:
• Default decay factor: 0.9
• Recent trends get higher weight in statistical calculations
• Older trends gradually decay in importance
• Rationale: Recent market behavior more relevant than old data
• Can be disabled for equal weighting
5. Backtest Statistics
System backtests its own duration estimates using historical data:
• Walks through past trends chronologically
• Calculates what duration estimate WOULD have been at each flip
• Compares to actual duration that occurred
• Displays accuracy metrics in duration analysis boxes and dashboard
• Helps assess statistical reliability on your specific chart
Note: Backtest uses only data available AT THE TIME of each historical flip (no lookahead bias).
TECHNICAL SPECIFICATIONS
• Pine Script Version: v6
• Indicator Type: Overlay (draws on price chart)
• Max Boxes: 500 (for duration analysis box storage)
• Max Bars Back: 5000 (for comprehensive historical analysis)
• Security Calls: 1 (for MTF if enabled - optimized)
• Repainting: NO - All signals and duration estimates confirmed on bar close
• Lookahead Bias: NO - All HTF data properly offset, all duration estimates use only historical data
• Real-time Updates: YES - Dashboard and quality scores update live
• Alert Capable: YES - Both automatic alerts and customizable alert conditions
• Multi-Symbol: Works on stocks, crypto, forex, futures, indices
Performance Optimization:
• Conditional calculations (duration analysis can be disabled to reduce load)
• Efficient array management (circular buffers for trend storage)
• Streamlined gradient rendering (26 layers, can be toggled off)
• Smart label cooldown system (prevents label spam)
• Optimized similarity matching (analyzes only relevant trends)
Data Requirements:
• Minimum 50-100 bars for initial duration analysis (builds historical database)
• Optimal: 500+ bars for robust statistical analysis
• Longer history = more accurate duration estimates
• Works on any timeframe from 1 minute to monthly
KNOWN LIMITATIONS
• Trending Markets Only: Performs best in clear trends. May generate false signals in choppy/sideways markets (use quality score filtering and regime detection to mitigate)
• Lagging Nature: Like all trend-following systems, signals occur AFTER trend establishment, not at exact tops/bottoms. Use duration analysis boxes to set realistic profit targets.
• Initial Learning Period: Duration analysis system requires 10-15 completed trends to build reliable historical database. Early duration estimates less accurate (first few weeks on new symbol/timeframe).
• Visual Load: 26-layer gradient ribbon may slow performance on older devices. Disable ribbon if experiencing lag.
• Statistical accuracy Variables: Duration estimates are statistical estimates, not guarantees. Accuracy varies by:
- Market regime (trending vs choppy)
- Asset volatility characteristics
- Quality of historical pattern matches
- Timeframe traded (higher TF = more reliable)
• Not Best Suitable For:
- Ultra-short-term scalping (sub-1-minute charts)
- Mean-reversion strategies (designed for trend-following)
- Range-bound trading (requires trending conditions)
- News-driven spikes (estimates based on technical patterns, not fundamentals)
FREQUENTLY ASKED QUESTIONS
Q: Does this indicator repaint?
A: Absolutely not. All signals, duration analysis boxes, labels, and alerts use barstate.isconfirmed checks. They only appear after the bar closes. What you see in history is exactly what you would have seen in real-time. Zero repaint guarantee.
Q: How accurate are the trend duration estimates?
A: Accuracy varies by mode, market conditions, and historical data quality:
• Simple mode: 60-70% accuracy (within ±20% of actual duration)
• Standard mode: 70-80% accuracy (within ±20% of actual duration)
• Advanced mode: 75-85% accuracy (within ±20% of actual duration)
Best accuracy achieved on:
• Higher timeframes (4H, Daily, Weekly)
• Trending markets (not choppy/sideways)
• Assets with consistent behavior (Blue Chip, Large Cap)
• After 20+ historical trends analyzed (builds robust database)
Remember: All duration estimates are statistical calculations based on historical patterns, not guarantees.
Q: Which analysis mode should I use?
A:
• Simple: Beginners, clean trending markets, want minimal complexity
• Standard: Most traders, general market conditions (RECOMMENDED DEFAULT)
• Advanced: Experienced traders, volatile/complex markets (biotech, small-cap, crypto), seeking maximum accuracy
Advanced mode requires correct Asset Type configuration for optimal results.
Q: What's the difference between the trading style presets?
A: Each preset optimizes ALL parameters for a specific trading approach:
• Scalping: Ultra-sensitive (ATR 7, Mult 2.0), more signals, shorter holds
• Day Trading: Balanced (ATR 10, Mult 2.5), moderate signals, intraday holds
• Swing Trading: Stable (ATR 14, Mult 3.0), fewer signals, multi-day holds
• Position Trading: Very stable (ATR 21, Mult 4.0), rare signals, week/month holds
Auto mode automatically selects based on your chart timeframe.
Q: Should I use Auto mode or manually select a preset?
A: Auto mode is recommended for most traders. It automatically matches settings to your timeframe and re-optimizes if you switch charts. Only use manual preset selection if:
• You want scalping settings on a 15m chart (overriding auto-detection)
• You want swing settings on a 1h chart (more conservative than auto would give)
• You're testing different approaches on same timeframe
Q: Can I use this for scalping and day trading?
A: Absolutely! The preset system is specifically designed for all trading styles:
• Select "Scalping (1-5m)" for 1-5 minute charts
• Select "Day Trading (15m-1h)" for 15m-1h charts
• Or use "Auto" mode and it configures automatically
Volume momentum filter is auto-disabled in Scalping mode for faster signals.
Q: What is Volume Momentum and why does it matter?
A: Volume Momentum compares short-term volume (fast MA) to long-term volume (slow MA). It answers: "Is money flowing into this asset faster now than historically?"
Why it matters:
• Volume often leads price (early warning system)
• Confirms institutional participation (smart money)
• No lag like price-based indicators
• More intuitive than complex mathematical filters
When the ratio is above 1.2, you have strong evidence that institutions are accumulating (bullish) or distributing (bearish).
Q: How do I set up alerts?
A: Two options:
Option 1 - Automatic Alerts:
1. Right-click on chart → Add Alert
2. Condition: Select this indicator
3. Choose "Any alert() function call"
4. Configure notification method (app, email, webhook)
5. You'll receive detailed alerts on every BUY and SELL signal
Option 2 - Customizable Alert Conditions:
1. Right-click on chart → Add Alert
2. Condition: Select this indicator
3. You'll see three options in dropdown:
- "BUY Signal" (long signals only)
- "SELL Signal" (short signals only)
- "ANY Signal" (both BUY and SELL)
4. Choose desired option and customize message template
5. Uses TradingView placeholders: {{ticker}}, {{close}}, {{time}}, etc.
All alerts fire only on confirmed bar close (no repaint).
Q: What is Scalpel Mode and should I use it?
A: Scalpel Mode waits for healthy pullbacks within established trends before signaling entry. It reduces whipsaws and improves entry timing.
Recommended ON for:
• Swing traders (want precision entries on pullbacks)
• Day traders (willing to wait for better prices)
• Risk-averse traders (prefer fewer but higher-quality entries)
Recommended OFF for:
• Scalpers (need immediate entries, can't wait for pullbacks)
• Momentum traders (want to enter on breakout, not pullback)
• Aggressive traders (prefer more opportunities over precision)
Q: Why do some duration estimates show wider ranges than others?
A: Range width reflects historical trend variability:
• Narrow range: Similar historical trends had consistent durations (high confidence)
• Wide range: Similar historical trends had varying durations (lower confidence)
Wide ranges often occur:
• Early in analysis (fewer historical trends to learn from)
• In volatile/choppy markets (inconsistent trend behavior)
• On lower timeframes (more noise, less consistency)
The median and average still provide useful targets even when range is wide.
Q: Can I customize the dashboard position and appearance?
A: Yes! Dashboard settings include:
• Position: 9 options (Top/Middle/Bottom + Left/Center/Right)
• Text Size: Auto, Tiny, Small, Normal, Large, Huge
• Show/Hide: Toggle entire dashboard on/off
Choose position that doesn't overlap important price action on your specific chart.
Q: Which timeframe should I trade on?
A: Depends on your trading style and time availability:
• 1-5 minute: Active scalping, requires constant monitoring
• 15m-1h: Day trading, check few times per session
• 4h-Daily: Swing trading, check once or twice daily
• Daily-Weekly: Position trading, check weekly
General principle: Higher timeframes produce:
• Fewer signals (less frequent)
• Higher quality setups (stronger confirmations)
• More reliable duration estimates (better statistical data)
• Less noise (clearer trends)
Start with Daily chart if new to trading. Move to lower timeframes as you gain experience.
Q: Does this work on all markets (stocks, crypto, forex)?
A: Yes, it works on all markets with trending characteristics:
Excellent for:
• Stocks (especially growth and momentum names)
• Crypto (BTC, ETH, major altcoins)
• Futures (indices, commodities)
• Forex majors (EUR/USD, GBP/USD, etc.)
Best results on:
• Trending markets (not range-bound)
• Liquid instruments (tight spreads, good fills)
• Volatile assets (clear trend development)
Less effective on:
• Range-bound/sideways markets
• Ultra-low volatility instruments
• Illiquid small-caps (use caution)
Configure Asset Type (in Advanced analysis mode) to match your instrument for best accuracy.
Q: How many signals should I expect per day/week?
A: Highly variable based on:
By Timeframe:
• 1-5 minute: 5-15 signals per session
• 15m-1h: 2-5 signals per day
• 4h-Daily: 2-5 signals per week
• Daily-Weekly: 1-2 signals per month
By Market Volatility:
• High volatility = more SuperTrend flips = more signals
• Low volatility = fewer flips = fewer signals
By Quality Filter:
• Higher threshold (60-70) = fewer but better signals
• Lower threshold (30-40) = more signals, lower quality
By Volume Momentum Filter:
• Enabled = Fewer signals (only volume-confirmed)
• Disabled = More signals (all SuperTrend flips)
Adjust quality threshold and filters to match your desired signal frequency.
Q: What's the difference between entry labels and info labels?
A:
Entry Labels (BUY/SELL):
• Your primary trading signals
• Based on SuperTrend flip + all confirmations (quality, volume, momentum)
• Include quality score and confirmation icons
• These are actionable entry points
Info Labels (Volume Spike):
• Additional market context
• Show volume events that may support or contradict trend
• 8-bar cooldown to prevent spam
• NOT necessarily entry points - contextual information only
Control separately: Can show entry labels without info labels (recommended for clean charts).
Q: Can I combine this with other indicators?
A: Absolutely! This works well with:
• RSI: For divergences and overbought/oversold conditions
• Support/Resistance: Confluence with key levels
• Fibonacci Retracements: Pullback targets in Scalpel Mode
• Price Action Patterns: Flags, pennants, cup-and-handle
• MACD: Additional momentum confirmation
• Bollinger Bands: Volatility context
This indicator provides trend direction and duration estimates - complement with other tools for entry refinement and additional confluence.
Q: Why did I get a low-quality signal? Can I filter them out?
A: Yes! Increase the Minimum Quality Score in settings.
If you're seeing signals with quality below your preference:
• Day Trading: Set minimum to 50
• Swing Trading: Set minimum to 60
• Position Trading: Set minimum to 70
Only signals meeting the threshold will appear. This reduces frequency but improves win-rate.
Q: How do I interpret the MTF Confluence count?
A: Shows how many of 6 timeframes agree with current trend:
• 6/6 aligned: Perfect agreement (extremely rare, highest confidence)
• 5/6 aligned: Very strong alignment (high confidence)
• 4/6 aligned: Good alignment (standard quality setup)
• 3/6 aligned: Moderate alignment (acceptable)
• 2/6 aligned: Weak alignment (caution)
• 1/6 aligned: Very weak (likely counter-trend)
Higher confluence typically correlates with longer, stronger trends. However, MTF analysis is optional - you can disable it and rely solely on quality scoring.
Q: Is this suitable for beginners?
A: Yes, but requires foundational knowledge:
You should understand:
• Basic trend-following concepts (higher highs, higher lows)
• Risk management principles (position sizing, stop losses)
• How to read candlestick charts
• What volume and volatility mean
Beginner-friendly features:
• Auto preset mode (zero configuration)
• Quality scoring (tells you signal strength)
• Dashboard tooltips (hover for explanations)
• duration analysis boxes (visual profit targets)
Recommended for beginners:
1. Start with "Auto" or "Swing Trading" preset on Daily chart
2. Use Standard Analysis Mode (not Advanced)
3. Set minimum quality to 60 (fewer but better signals)
4. Paper trade first for 2-4 weeks
5. Study methodology references (Minervini, O'Neil, Zanger)
Q: What is the Asset Type setting and why does it matter?
A: Asset Type (in Advanced analysis mode) adjusts duration estimates based on volatility characteristics:
• Small Cap: Explosive moves, extended trends (+30-40%)
• Biotech / Speculative: Parabolic potential, news-driven (+40%)
• Blue Chip / Large Cap: Baseline, steady trends (0% adjustment)
• Tech Growth: Momentum-driven, longer trends (+20%)
• Dividend / Value: Slower, grinding trends (-20%)
• Cyclical: Macro-driven, variable (±10%)
• Crypto / High Volatility: Parabolic potential (+30%)
Correct configuration improves Statistical accuracy by 15-20%. Using Blue Chip settings on a biotech stock may underestimate trend length (you'll exit too early).
Q: Can I backtest this indicator?
A: Yes! TradingView's Strategy Tester works with this indicator's signals.
To backtest:
1. Note the entry conditions (SuperTrend flip + quality threshold + filters)
2. Create a strategy script using same logic
3. Run Strategy Tester on historical data
Additionally, the indicator includes BUILT-IN duration estimate validation:
• System backtests its own duration estimates
• Shows accuracy metrics in dashboard and duration analysis boxes
• Helps assess reliability on your specific symbol/timeframe
Q: Why does Volume Momentum auto-disable in Scalping mode?
A: Scalping requires ultra-fast entries to catch quick moves. Volume Momentum filter adds friction by requiring volume confirmation before signaling, which can cause missed opportunities in rapid scalping.
Scalping preset is optimized for speed and frequency - the filter is counterproductive for that style. It remains enabled for Day Trading, Swing Trading, and Position Trading presets where patience improves results.
You can manually enable it in Custom mode if desired.
Q: How much historical data do I need for accurate duration estimates?
A:
Minimum: 50-100 bars (indicator will function but duration estimates less reliable)
Recommended: 500+ bars (robust statistical database)
Optimal: 1000+ bars (maximum Statistical accuracy)
More history = more completed trends = better pattern matching = more accurate duration estimates.
New symbols or newly-switched timeframes will have lower Statistical accuracy initially. Allow 2-4 weeks for the system to build historical database.
IMPORTANT DISCLAIMERS
No Guarantee of Profit:
This indicator is an educational tool and does not guarantee any specific trading results. All trading involves substantial risk of loss. Duration estimates are statistical calculations based on historical patterns and are not guarantees of future performance.
Past Performance:
Historical backtest results and Statistical accuracy statistics do not guarantee future performance. Market conditions change constantly. What worked historically may not work in current or future markets.
Not Financial Advice:
This indicator provides technical analysis signals and statistical duration estimates only. It is not financial, investment, or trading advice. Always consult with a qualified financial advisor before making investment decisions.
Risk Warning:
Trading stocks, options, futures, forex, and cryptocurrencies involves significant risk. You can lose all of your invested capital. Never trade with money you cannot afford to lose. Only risk capital you can lose without affecting your lifestyle.
Testing Required:
Always test this indicator on a demo account or with paper trading before risking real capital. Understand how it works in different market conditions. Verify Statistical accuracy on your specific instruments and timeframes before trusting it with real money.
User Responsibility:
You are solely responsible for your trading decisions. The developer assumes no liability for trading losses, incorrect duration estimates, software errors, or any other damages incurred while using this indicator.
Statistical Estimation Limitations:
Trend Duration estimates are statistical estimates based on historical pattern matching. They are NOT guarantees. Actual trend durations may differ significantly from duration estimates due to unforeseen news events, market regime changes, or lack of historical precedent for current conditions.
CREDITS & ACKNOWLEDGMENTS
Methodology Inspiration:
• Mark Minervini - Volatility Contraction Pattern (VCP) concepts and pullback entry techniques
• William O'Neil - Volume analysis principles and CANSLIM institutional buying patterns
• Dan Zanger - Momentum breakout strategies and volatility expansion entries
Technical Components:
• SuperTrend calculation - Classic ATR-based trend indicator (public domain)
• Statistical analysis - Standard median, average, range calculations
• k-Nearest Neighbors - Classic machine learning similarity matching concept
• Multi-timeframe analysis - Standard request.security implementation in Pine Script
For questions, feedback, or support, please comment below or send a private message.
Happy Trading!

Clock&Flow – Market Pulse IndicatorClock&Flow – Market Pulse Indicator
1) General Purpose
The Market Pulse Indicator is designed to visualize the strength and direction of market flow in a clear, intuitive way.
Unlike common volume or momentum indicators, it blends three essential dimensions — price velocity, normalized volume, and volatility (ATR) — to highlight when market pressure is truly meaningful.
It helps identify genuine liquidity inflows/outflows, potential exhaustion zones, and moments of compression or expansion within the price structure.
2) Data Sources
All data is directly taken from the current chart’s feed on TradingView:
Price (close): to measure relative price change.
Volume: to detect the intensity of market participation (normalized to average).
ATR (Average True Range): to evaluate volatility relative to price levels.
No external data or off-platform sources are used.
3) Logic and Calculation Steps
Price Velocity: calculates the percentage change between the current close and the close N bars ago.
priceChange = (close - close ) / close
Normalized Volume: compares current volume to its moving average over the same period.
volNorm = volume / sma(volume, length)
Normalized Volatility: ATR divided by price to adjust for instrument scale.
atrNorm = atr(length) / close
Combination : multiplies the three components into one raw value that represents market pulse intensity.
rawPulse = priceChange * volNorm * (1 + atrNorm)
Smoothing: a moving average (smoothLen) is applied to create a cleaner and more readable oscillator line.
flowPulse = sma(rawPulse * multiplier, smoothLen)
4) Parameters (Default Settings)
length (20): analysis period for price change, volume, and ATR.
smoothLen (5): smoothing factor; higher values reduce noise.
multiplier (100): scales the output for readability; adjust to fit chart scale.
5) How to Read the Indicator
Market Pulse > 0 (green): net inflow of liquidity; buying pressure dominates.
Market Pulse < 0 (red): net outflow of liquidity; selling pressure dominates.
Near 0: neutral phase; market balance or consolidation.
Sudden peaks: strong bursts of flow — often coincide with news releases or session overlaps.
Confirmations: use as a second-level filter before entering trades or to confirm momentum behind a breakout.
6) Divergences
Divergences between price and Market Pulse are key signals of weakening flow strength:
Bullish divergence: price forms lower lows while Market Pulse forms higher lows → selling pressure is fading; potential reversal or bounce.
Bearish divergence: price forms higher highs while Market Pulse fails to confirm → buying momentum is losing strength; potential correction ahead.
For reliability, look for divergences on higher timeframes (H4, Daily).
On lower timeframes, treat them as early warnings.
7) Typical Use Cases
Breakout confirmation: price breaks resistance with a rising Market Pulse → confirms genuine participation.
False signal filter: price breaks a level but Market Pulse remains flat/negative → likely fake breakout.
Pullback entry: after a breakout, wait for a short retracement and a new positive pulse → safer entry point.
Exit signal: if you’re long and Market Pulse suddenly turns negative with strong volume → consider partial exit or tighter stops.
8) Recommended Timeframes
Intraday / Scalping: 5–30 min charts with length 10–14, smoothLen 3–5.
Swing trading: 1h–4h charts with length 20–50.
Position trading: Daily charts with larger length (50–100) for smoother data.
Always optimize parameters to the specific asset — there are no universal settings.
9) Limitations
This indicator is not a trading system — it’s a decision-support tool.
Results depend on the quality of the volume data available for the symbol.
Performance and sensitivity are influenced by length, smoothing, and multiplier values — always test before live trading.
Use alongside sound risk and money management.
10) Disclaimer
This script is provided for educational purposes only and does not constitute financial advice.
Trading and investing involve significant risk, including the potential loss of capital.
Always test indicators in simulation environments and make independent decisions based on your own analysis and risk tolerance.
Italiano
1) Scopo generale
Flow Pulse è un oscillatore pensato per visualizzare la forza e la direzione del flusso di mercato in modo immediato. Non è un semplice indicatore di volume né una copia di RSI/MACD: combina tre dimensioni fondamentali — variazione di prezzo, volume normalizzato e volatilità — per mettere in evidenza i momenti in cui la pressione dei partecipanti è realmente significativa.
È ideale per identificare: entrate guidate da flussi reali, potenziali esaurimenti, momenti di compressione/espansione del movimento e segnali di conferma per breakout o rimbalzi.
2) Dati utilizzati
L’indicatore usa esclusivamente dati disponibili sulla piattaforma TradingView del grafico corrente:
price (close) — per calcolare la variazione percentuale del prezzo;
volume per misurare l’intensità degli scambi (normalizzato su media);
ATR (Average True Range) — per normalizzare la volatilità rispetto al prezzo;
Tutti i feed (prezzo e volume) sono quelli forniti dall’exchange/fornitore dati collegato al simbolo sul grafico.
3) Logica e passaggi di calcolo
Velocità del prezzo: calcolo della variazione percentuale tra la chiusura corrente e la chiusura N barre fa:
priceChange = (close - close ) / close
— misura la direzione e magnitudine del movimento in termine relativo.
Volume normalizzato: rapporto tra il volume corrente e la media mobile semplice del volume su length barre:
volNorm = volume / sma(volume, length)
— evidenzia volumi anomali rispetto alla media.
Volatilità normalizzata (ATR): rapporto ATR/close per rendere la volatilità comparabile across price levels:
atrNorm = atr(length) / close
Combinazione: il prodotto di questi fattori (con un piccolo offset su ATR) genera un valore grezzo:
rawPulse = priceChange * volNorm * (1 + atrNorm)
— se priceChange e volNorm sono positivi e l’ATR è presente, il rawPulse sarà significativamente positivo.
Smoothing: media mobile semplice (SMA) applicata al rawPulse e moltiplicazione per un fattore scalare (multiplier) per portare il range su livelli leggibili:
flowPulse = sma(rawPulse * multiplier, smoothLen)
4) Parametri esposti (default consigliati)
length (periodo analisi) — default 20: influenza calcolo Δ% e media volumi; allunga la finestra storica.
smoothLen (smussamento) — default 5: smoothing del segnale per ridurre rumore.
multiplier — default 100: fattore di scala per rendere l’oscillatore più leggibile.
5) Interpretazione pratica dei valori
FlowPulse > 0 (verde): predominanza di flusso d’ingresso — pressione d’acquisto. Maggiore il valore, più forte la convinzione (volume + movimento + volatilità).
FlowPulse < 0 (rosso): predominanza di flusso in uscita — pressione di vendita.
Vicino a 0: assenza di flussi netti chiari; mercato piatto o bilanciato.
Picchi repentini: indicano accelerate di flusso — spesso coincidono con rotture, open/close session, news.
Sostegno al trade: usa FlowPulse come conferma prima di entrare su breakout o come avviso di attenzione su esaurimenti.
6) Divergenze (come leggerle)
Le divergenze tra prezzo e FlowPulse sono segnali importanti:
Divergenza rialzista (bullish divergence): prezzo fa nuovi minimi mentre FlowPulse non fa nuovi minimi (o forma minimo relativo più alto) → indica che la spinta di vendita non è supportata da volume/volatilità, possibile inversione/rimbalzo.
Divergenza ribassista (bearish divergence): prezzo fa nuovi massimi mentre FlowPulse non li conferma (o forma massimo relativo più basso) → la spinta d’acquisto è “debole”, possibile esaurimento e inversione.
Note pratiche: cercare divergenze su timeframe maggiori (H4, D) per maggiore attendibilità; sui timeframe minori prendere solo come early warning.
7) Esempi d’uso operativo
Conferma breakout: prezzo rompe resistenza + FlowPulse positivo e crescente → breakout più probabile e con volumi reali.
Filtro per falsi segnali: prezzo rompe ma FlowPulse è piatto/negativo → alto rischio di false breakout.
Entrata per pullback: dopo breakout, attendere un pullback con FlowPulse che torna positivo → ingresso più prudente.
Gestione delle uscite: se sei long e FlowPulse improvvisamente si inverte in negativo su volumi elevati → considerare riduzione posizione o stop.
8) Timeframe consigliati
Intraday / Scalping: M5–M30 con length ridotto (es. 10–14) e smoothLen piccolo.
Swing trading: H1–H4 con length 20–50.
Position trading: D1 con length maggiore per filtrare rumore.
Testa i parametri sul tuo asset e timeframe; nessun parametro è universale.
9) Limitazioni e avvertenze
L’indicatore non è un sistema di trading completo: è un tool di informazione e timing.
Dipende dalla qualità dei dati di volume del simbolo: su alcuni titoli/mercati (es. alcuni ETF, Forex su certi broker) il volume può essere parziale o non rappresentativo.
I valori di margine/multiplier e smoothing influenzano sensibilmente sensibilità e falsi segnali: backtest e ottimizzazione sono raccomandati.
Non usare il solo FlowPulse per entrare su leva elevata senza gestione del rischio12) Disclaimer da inserire
Disclaimer: Questo indicatore è fornito solo a scopo didattico e non costituisce consulenza finanziaria. L’uso comporta rischi: valuta sempre la gestione del rischio e testa su conto demo prima dell’applicazione in reale.

Canuck Trading IndicatorOverview
The Canuck Trading Indicator is a versatile, overlay-based technical analysis tool designed to assist traders in identifying potential trading opportunities across various timeframes and market conditions. By combining multiple technical indicators—such as RSI, Bollinger Bands, EMAs, VWAP, MACD, Stochastic RSI, ADX, HMA, and candlestick patterns—the indicator provides clear visual signals for bullish and bearish entries, breakouts, long-term trends, and options strategies like cash-secured puts, straddles/strangles, iron condors, and short squeezes. It also incorporates 20-day and 200-day SMAs to detect Golden/Death Crosses and price positioning relative to these moving averages. A dynamic table displays key metrics, and customizable alerts help traders stay informed of market conditions.
Key Features
Multi-Timeframe Adaptability: Automatically adjusts parameters (e.g., ATR multiplier, ADX period, HMA length) based on the chart's timeframe (minute, hourly, daily, weekly, monthly) for optimal performance.
Comprehensive Signal Generation: Identifies short-term entries, breakouts, long-term bullish trends, and options strategies using a combination of momentum, trend, volatility, and candlestick patterns.
Candlestick Pattern Detection: Recognizes bullish/bearish engulfing, hammer, shooting star, doji, and strong candles for precise entry/exit signals.
Moving Average Analysis: Plots 20-day and 200-day SMAs, detects Golden/Death Crosses, and evaluates price position relative to these averages.
Dynamic Table: Displays real-time metrics, including zone status (bullish, bearish, neutral), RSI, MACD, Stochastic RSI, short/long-term trends, candlestick patterns, ADX, ROC, VWAP slope, and MA positioning.
Customizable Alerts: Over 20 alert conditions for entries, exits, overbought/oversold warnings, and MA crosses, with actionable messages including ticker, price, and suggested strategies.
Visual Clarity: Uses distinct shapes, colors, and sizes to plot signals (e.g., green triangles for bullish entries, red triangles for bearish entries) and overlays key levels like EMA, VWAP, Bollinger Bands, support/resistance, and HMA.
Options Strategy Signals: Suggests opportunities for selling cash-secured puts, straddles/strangles, iron condors, and capitalizing on short squeezes.
How to Use
Add to Chart: Apply the indicator to any TradingView chart by selecting "Canuck Trading Indicator" from the Pine Script library.
Interpret Signals:
Bullish Signals: Green triangles (short-term entry), lime diamonds (breakout), blue circles (long-term entry).
Bearish Signals: Red triangles (short-term entry), maroon diamonds (breakout).
Options Strategies: Purple squares (cash-secured puts), yellow circles (straddles/strangles), orange crosses (iron condors), white arrows (short squeezes).
Exits: X-cross shapes in corresponding colors indicate exit signals.
Monitor: Gray circles suggest holding cash or monitoring for setups.
Review Table: Check the top-right table for real-time metrics, including zone status, RSI, MACD, trends, and MA positioning.
Set Alerts: Configure alerts for specific signals (e.g., "Short-Term Bullish Entry" or "Golden Cross") to receive notifications via TradingView.
Adjust Inputs: Customize input parameters (e.g., RSI period, EMA length, ATR period) to suit your trading style or market conditions.
Input Parameters
The indicator offers a wide range of customizable inputs to fine-tune its behavior:
RSI Period (default: 14): Length for RSI calculation.
RSI Bullish Low/High (default: 35/70): RSI thresholds for bullish signals.
RSI Bearish High (default: 65): RSI threshold for bearish signals.
EMA Period (default: 15): Main EMA length (15 for day trading, 50 for swing).
Short/Long EMA Length (default: 3/20): For momentum oscillator.
T3 Smoothing Length (default: 5): Smooths momentum signals.
Long-Term EMA/RSI Length (default: 20/15): For long-term trend analysis.
Support/Resistance Lookback (default: 5): Periods for support/resistance levels.
MACD Fast/Slow/Signal (default: 12/26/9): MACD parameters.
Bollinger Bands Period/StdDev (default: 15/2): BB settings.
Stochastic RSI Period/Smoothing (default: 14/3/3): Stochastic RSI settings.
Uptrend/Short-Term/Long-Term Lookback (default: 2/2/5): Candles for trend detection.
ATR Period (default: 14): For volatility and price targets.
VWAP Sensitivity (default: 0.1%): Threshold for VWAP-based signals.
Volume Oscillator Period (default: 14): For volume surge detection.
Pattern Detection Threshold (default: 0.3%): Sensitivity for candlestick patterns.
ROC Period (default: 3): Rate of change for momentum.
VWAP Slope Period (default: 5): For VWAP trend analysis.
TradingView Publishing Compliance
Originality: The Canuck Trading Indicator is an original script, combining multiple technical indicators and custom logic to provide unique trading signals. It does not replicate existing public scripts.
No Guaranteed Profits: This indicator is a tool for technical analysis and does not guarantee profits. Trading involves risks, and users should conduct their own research and risk management.
Clear Instructions: The description and usage guide are detailed and accessible, ensuring users understand how to apply the indicator effectively.
No External Dependencies: The script uses only built-in Pine Script functions (e.g., ta.rsi, ta.ema, ta.vwap) and requires no external libraries or data sources.
Performance: The script is optimized for performance, using efficient calculations and adaptive parameters to minimize lag on various timeframes.
Visual Clarity: Signals are plotted with distinct shapes and colors, and the table provides a concise summary of market conditions, enhancing usability.
Limitations and Risks
Market Conditions: The indicator may generate false signals in choppy or low-liquidity markets. Always confirm signals with additional analysis.
Timeframe Sensitivity: Performance varies by timeframe; test settings on your preferred chart (e.g., 5-minute for day trading, daily for swing trading).
Risk Management: Use stop-losses and position sizing to manage risk, as suggested in alert messages (e.g., "Stop -20%").
Options Trading: Options strategies (e.g., straddles, iron condors) carry unique risks; consult a financial advisor before trading.
Feedback and Support
For questions, suggestions, or bug reports, please leave a comment on the TradingView script page or contact the author via TradingView. Your feedback helps improve the indicator for the community.
Disclaimer
The Canuck Trading Indicator is provided for educational and informational purposes only. It is not financial advice. Trading involves significant risks, and past performance is not indicative of future results. Always perform your own due diligence and consult a qualified financial advisor before making trading decisions.

Liquidity Heatmap [Eˣ]💧 Liquidity Heatmap - Free Indicator
Overview
The Liquidity Heatmap reveals where stop losses are clustered in the market - the hidden liquidity zones that smart money targets. This indicator automatically identifies Buy-Side Liquidity (BSL) above price and Sell-Side Liquidity (SSL) below price, showing you exactly where institutional traders are likely to hunt for stops before major moves.
━━━━━━━━━━━━━━━━━━━━━━━━━━━━
🎯 What This Indicator Does
Identifies Liquidity Zones:
• Buy-Side Liquidity (BSL) - Stop losses from SHORT positions clustered above price
• Sell-Side Liquidity (SSL) - Stop losses from LONG positions clustered below price
• Automatically clusters nearby levels into high-probability zones
• Shows liquidity strength (1-5+) - higher numbers = more stops = bigger target
• Removes swept liquidity in real-time as price takes out stops
Visual Display:
• 🔴 Red Zones Above Price = Buy-Side Liquidity (shorts' stops)
• 🟢 Green Zones Below Price = Sell-Side Liquidity (longs' stops)
• Thicker/Darker Zones = Higher liquidity concentration
• BSL/SSL Labels = Show exact strength count
• Triangle Markers = Liquidity sweep alerts (when price takes stops)
Smart Features:
• Auto-removes old liquidity (customizable lookback period)
• Clusters nearby levels to reduce noise
• Tracks liquidity strength and age
• Updates in real-time as new swing points form
• Alerts when major liquidity zones are swept
━━━━━━━━━━━━━━━━━━━━━━━━━━━━
📊 How To Use This Indicator
Understanding Liquidity Concepts
What is Liquidity?
Liquidity refers to clusters of stop loss orders sitting in the market. These stops represent:
• Long traders' stop losses (below support) = Sell-Side Liquidity
• Short traders' stop losses (above resistance) = Buy-Side Liquidity
Why Does This Matter?
• Institutions NEED liquidity to fill large orders
• Price often "sweeps" liquidity zones before reversing
• Major liquidity = major target for smart money
• Understanding liquidity = understanding market maker behavior
The Liquidity Cycle:
1. Retail traders place stops at obvious levels (swing highs/lows)
2. Smart money identifies these clusters
3. Price is pushed to sweep the stops (liquidity grab)
4. Institutions fill their orders with this liquidity
5. Price reverses in the opposite direction
━━━━━━━━━━━━━━━━━━━━━━━━━━━━
💡 Trading Strategies
Strategy 1: Liquidity Sweep Reversals
Best For: Swing trading, catching reversals
Timeframes: 15min, 1H, 4H, Daily
Entry Setup:
1. Identify strong Sell-Side Liquidity (SSL) zone below price
2. Wait for price to sweep down into the SSL zone
3. Look for rejection/reversal candle pattern (pin bar, engulfing)
4. Enter LONG after sweep and reversal confirmation
5. Stop loss: Below the swept liquidity zone
6. Target: Opposite liquidity zone or key resistance
Why It Works: Smart money sweeps stops to fill buy orders, then pushes price higher
Example:
• SSL zone at $45,000 with strength 3
• Price drops to $44,950, sweeps the SSL
• Strong bullish reversal candle forms
• Enter long at $45,100
• Target: BSL zone at $47,000
Strategy 2: Liquidity-to-Liquidity Runs
Best For: Day trading, scalping
Timeframes: 5min, 15min, 1H
Entry Setup:
1. Price sweeps Sell-Side Liquidity below and reverses up
2. Identify Buy-Side Liquidity zone above
3. Enter LONG targeting the BSL zone above
4. Exit near/at the BSL zone (don't wait for sweep)
5. Stop loss: Below recent swing low
Why It Works: Price moves from liquidity pool to liquidity pool
Variation - Reverse for Shorts:
• BSL sweep above → Look for SSL zone below
• Enter short targeting lower liquidity
Strategy 3: Liquidity Avoidance (Stop Placement)
Best For: Improving win rate on existing strategies
Timeframes: All
Rules:
1. NEVER place stops exactly at obvious liquidity zones
2. Place stops beyond the liquidity zone with buffer
3. Or place stops before the liquidity zone (tighter, riskier)
4. Monitor liquidity strength - avoid zones with strength 3+
Why It Works: Market makers hunt obvious stop clusters
Example:
• Trading long, swing low at $100 (SSL zone, strength 4)
• Bad: Stop at $99.50 (will get swept)
• Better: Stop at $98.50 (beyond the liquidity)
• Alternative: Stop at $100.50 (tighter, before sweep zone)
Strategy 4: Confluence Trading
Best For: High probability setups
Timeframes: 1H, 4H, Daily
Entry Setup:
1. Find liquidity zone that aligns with:
• Major support/resistance level
• Fibonacci retracement (0.618, 0.786)
• Trendline
• Round psychological number ($50,000, $2,000, etc)
2. Wait for sweep of this high-confluence zone
3. Enter on reversal with multiple confirmations
4. Larger position size justified by confluence
Why It Works: Multiple factors = institutional interest = higher probability
━━━━━━━━━━━━━━━━━━━━━━━━━━━━
⚙️ Settings Explained
Core Settings
Swing Detection Length (Default: 10)
• Number of bars left/right to identify swing highs and lows
• Lower values (5-8): More sensitive, more liquidity zones, more noise
• Higher values (12-20): Less sensitive, only major swings, cleaner chart
• Recommended: 8-10 for intraday, 10-15 for swing trading
Liquidity Lookback Bars (Default: 100)
• How many historical bars to track liquidity zones
• Lower values (50-75): Shows only recent liquidity
• Higher values (100-200): Shows longer-term liquidity clusters
• Zones older than this are automatically removed
• Recommended: 100-150 for most timeframes
Zone Proximity % (Default: 0.5)
• Percentage threshold to group nearby levels into single zone
• Lower values (0.2-0.4): Keeps levels separate, more zones
• Higher values (0.6-1.0): Aggressive clustering, fewer zones
• Recommended: 0.4-0.6 for crypto, 0.3-0.5 for forex, 0.5-0.8 for stocks
Visualization Settings
Show Buy-Side Liquidity
• Toggle ON/OFF red zones above price
• Turn OFF if only interested in downside liquidity
Show Sell-Side Liquidity
• Toggle ON/OFF green zones below price
• Turn OFF if only interested in upside liquidity
Show Liquidity Labels
• Toggle BSL/SSL labels with strength numbers
• Turn OFF for cleaner chart appearance
• Keep ON to see exact liquidity strength
Display Style
• Boxes: Filled rectangular zones (best for visualizing strength)
• Lines: Horizontal dashed lines (minimal, clean look)
• Both: Boxes + Lines (maximum visibility)
Color Intensity
• Low: 85% transparency (subtle, less distracting)
• Medium: 75% transparency (balanced visibility)
• High: 65% transparency (bold, maximum visibility)
━━━━━━━━━━━━━━━━━━━━━━━━━━━━
📱 Info Panel Guide
Located in the top-right corner, the info panel provides real-time liquidity statistics:
Buy-Side Zones
• Count of active BSL zones above current price
• Higher number = More upside targets for price
Sell-Side Zones
• Count of active SSL zones below current price
• Higher number = More downside targets for price
Total Zones
• Combined count of all active liquidity
• Useful for gauging overall market structure
Nearest BSL
• Distance in % to closest Buy-Side Liquidity above
• Example: +2.5% means BSL is 2.5% above current price
• Quick reference for next upside target
Nearest SSL
• Distance in % to closest Sell-Side Liquidity below
• Example: -1.8% means SSL is 1.8% below current price
• Quick reference for next downside target
Liquidity Bias
• ⬆️ Bullish : More BSL than SSL (upside targets dominate)
• ⬇️ Bearish : More SSL than BSL (downside targets dominate)
• ↔️ Balanced: Equal liquidity on both sides (range-bound)
━━━━━━━━━━━━━━━━━━━━━━━━━━━━
🎓 Understanding Liquidity Strength
What Do The Numbers Mean?
Strength 1 : Single swing point
• Light liquidity, minor target
• Can be ignored in trending markets
• Useful in ranging/choppy conditions
Strength 2-3 : Moderate liquidity cluster
• Multiple nearby swing points merged
• Decent target for intraday moves
• Watch for potential sweeps
Strength 4-5 : Strong liquidity cluster
• Major cluster of stops
• High-probability target for institutions
• Expect reactions when swept
Strength 6+ : Extreme liquidity pool
• Massive stop cluster (rare)
• Critical zone - high probability of sweep
• Often marks major support/resistance
• Ideal for confluence setups
━━━━━━━━━━━━━━━━━━━━━━━━━━━━
📱 Alert Setup
This indicator includes 2 powerful alert types:
1. Buy-Side Liquidity Sweep
• Triggers when price sweeps BSL zone above
• Shows potential bullish reversal opportunity
• Often precedes upward continuation after sweep
2. Sell-Side Liquidity Sweep
• Triggers when price sweeps SSL zone below
• Shows potential bearish reversal opportunity
• Often precedes downward continuation after sweep
To Set Up Alerts:
1. Click the "Alert" button (clock icon) in TradingView
2. Condition: Select "Liquidity Heatmap"
3. Choose alert type: BSL Sweep or SSL Sweep
4. Configure notification method (push, email, webhook)
5. Click "Create"
Pro Tip: Set alerts for both BSL and SSL sweeps to catch opportunities in both directions
━━━━━━━━━━━━━━━━━━━━━━━━━━━━
💎 Pro Tips & Best Practices
✅ DO:
• Wait for confirmation - Don't enter immediately on sweep, wait for reversal pattern
• Combine with trend - SSL sweeps in uptrends = higher probability longs
• Check multiple timeframes - 1H liquidity + 4H liquidity = strongest zones
• Monitor strength - Focus on zones with strength 3+
• Use proper risk management - Liquidity sweeps can go further than expected
• Watch for re-sweeps - Sometimes liquidity zones get swept multiple times
• Consider volume - High volume sweeps = stronger reversal potential
⚠️ DON'T:
• Don't fade strong trends - In strong trends, sweeps often continue rather than reverse
• Don't overtrade - Not every sweep is a tradeable setup
• Don't ignore context - Check broader market conditions and news
• Don't use alone - Combine with price action, support/resistance, and other analysis
• Don't place stops at liquidity - Your stops will be hunted
• Don't expect perfection - Some sweeps fail, some zones never get hit
🎯 Best Timeframes:
• Scalping: 5min, 15min (fast moves, frequent sweeps)
• Day Trading: 15min, 1H (balanced view)
• Swing Trading: 1H, 4H, Daily (major liquidity zones)
• Position Trading: 4H, Daily, Weekly (institutional liquidity)
🔥 Best Markets:
• Crypto (high volatility, frequent liquidity grabs)
• Forex (EUR/USD, GBP/USD - liquid pairs)
• Futures (ES, NQ, CL - high liquidity contracts)
• Stocks (large caps with high volume)
⏰ Best Times:
• Market opens (high volatility = liquidity hunting)
• Before/after major news events
• Session overlaps (London/NY for forex)
• First hour and last hour of trading
━━━━━━━━━━━━━━━━━━━━━━━━━━━━
🚀 What Makes This Different?
Unlike basic pivot indicators, the Liquidity Heatmap:
• Institutional Perspective - Shows where smart money hunts stops
• Dynamic Clustering - Automatically groups nearby levels for clarity
• Strength Tracking - Not just where, but HOW MUCH liquidity exists
• Auto-Cleanup - Removes swept and old liquidity automatically
• Visual Clarity - Instant understanding of market structure
• Actionable - Clear targets and reversal zones for trading
• Real-Time Updates - Adapts as market structure evolves
Based On Professional Concepts:
• Order flow analysis
• Market maker behavior
• Institutional trading techniques
• Liquidity engineering principles
━━━━━━━━━━━━━━━━━━━━━━━━━━━━
📈 Common Liquidity Patterns
Pattern 1: The Double Sweep
• Price sweeps SSL below, reverses up
• Price sweeps BSL above, reverses down
• Back to original range
• Trading: Fade the second sweep for mean reversion
Pattern 2: The Cascade
• Multiple SSL zones stacked below
• Price sweeps first zone, continues to next
• Chain reaction of stop losses triggering
• Trading: Ride the momentum to lowest zone
Pattern 3: The Fake-Out
• Price approaches liquidity but doesn't quite sweep
• Reverses before hitting the zone
• "Scared money" didn't wait for full sweep
• Trading: Wait for actual sweep, don't anticipate
Pattern 4: The Absorption
• Price sweeps major liquidity zone (strength 5+)
• No reversal, just consolidation
• Institutions absorbed all liquidity
• Trading: Wait for breakout direction, likely continuation
━━━━━━━━━━━━━━━━━━━━━━━━━━━━
📈 Upgrade Your Trading Arsenal
This free indicator gives you institutional-level liquidity analysis. Want more?
🔥 Check out my premium scripts for:
• Automated entry signals with liquidity confirmation
• Multi-timeframe liquidity analysis
• Advanced stop loss management that avoids liquidity zones
• Backtested strategies with performance tracking
• Custom alerts for high-probability setups
• And much more...
👉 Visit my profile to see all available tools!
━━━━━━━━━━━━━━━━━━━━━━━━━━━━
📝 Important Notes
• Liquidity analysis is one piece of the puzzle - use with other analysis methods
• Not all liquidity zones get swept - some remain untouched
• Market conditions change - adapt your strategy accordingly
• Always use proper position sizing and risk management
• Liquidity sweeps can be violent - use appropriate stop losses
• Practice on demo accounts before trading with real capital
• Past liquidity patterns don't guarantee future price action
Disclaimer: This indicator is for educational purposes. Trading involves risk. Always do your own research and never risk more than you can afford to lose.
━━━━━━━━━━━━━━━━━━━━━━━━━━━━
🙏 Support This Work
If you find this indicator valuable:
• ⭐ Give it a thumbs up
• 💬 Share your best liquidity sweep trades in the comments
• 🔔 Follow for more free professional-grade tools
• 🚀 Share with traders who need to understand liquidity
Got questions? Drop a comment and I'll help you master liquidity trading!
━━━━━━━━━━━━━━━━━━━━━━━━━━━━
Developed with ❤️ for traders who want to think like institutions
━━━━━━━━━━━━━━━━━━━━━━━━━━━━
Version History
• v1.0 - Initial release with dynamic liquidity detection and clustering

Bitcoin Multibook v1.0 [Apollo Algo]Bitcoin Multibook v1.0 by Apollo Algo is an advanced market depth and order flow visualization tool that brings professional-grade multi-exchange order book analysis to TradingView. Inspired by Bookmap's multibook functionality and built upon LucF's original single "Tape" indicator concept, this tool aggregates real-time trading data from multiple Bitcoin exchanges into a unified tape display.
Credits & Attribution
This indicator is an evolution of the original "Tape" indicator created by LucF (TradingView: @LucF). The multibook enhancement and Bitcoin-specific optimizations were developed by Apollo Algo to provide traders with institutional-grade market microstructure visibility across major Bitcoin trading venues.
Purpose & Philosophy
Bitcoin leads the entire cryptocurrency market. By monitoring order flow across the primary Bitcoin exchanges simultaneously, traders gain crucial insights into:
Cross-exchange arbitrage opportunities
Institutional order flow patterns
Market maker positioning
True market sentiment beyond single-exchange data
Key Features
📊 Multi-Exchange Data Aggregation
Real-time tape from 3 major exchanges:
Binance (BTCUSDT)
Coinbase (BTCUSD)
Kraken (BTCUSD)
Customizable source inputs for any trading pair
Synchronized price and volume tracking
Exchange name identification in tape display
📈 Advanced Tape Display
Dynamic tape visualization with configurable line quantity (0-50 lines)
Directional flow indicators (+/- symbols for price changes)
Exchange identification for each trade
Volume precision control (0-16 decimal places)
Flexible positioning (9 screen positions available)
Real-time only operation for accurate order flow
🎯 Volume Delta Analysis
Real-time cumulative volume delta calculation
Divergence detection (price vs. volume direction)
Colored visual feedback for market sentiment
Total session delta displayed in footer
Cross-exchange delta aggregation
🚨 Smart Alert System
Marker 1: Volume Delta Bumps (⬆⬇)
Triggers on consecutive volume delta increases
Identifies momentum acceleration points
Filters out divergent movements
Marker 2: Volume Delta Thresholds (⇑⇓)
Fires when delta exceeds user-defined thresholds
Catches significant order imbalances
Excludes divergence conditions
Marker 3: Large Volume Detection (⤊⤋)
Highlights unusually large individual trades
Spots potential institutional activity
Direction-specific triggers
Configure Data Sources
Adjust exchange pairs if needed (e.g., for altcoin analysis)
Leave blank to disable specific exchanges
Use format: EXCHANGE:SYMBOL
Customize Display
Set tape line quantity based on screen size
Position the table for optimal visibility
Choose color scheme (text or background)
Adjust text size for readability
Configure Alerts
Enable desired markers (1, 2, or 3)
Set volume thresholds appropriate for your timeframe
Choose direction (Longs, Shorts, or Both)
Create TradingView alerts on marker signals
Trading Applications
Scalping (1-5 min)
Monitor tape speed for momentum shifts
Watch for cross-exchange divergences
Track large volume clusters
Use Marker 1 for quick momentum trades
Day Trading (5-60 min)
Identify accumulation/distribution phases
Spot institutional positioning
Confirm breakout validity with volume delta
Use Marker 2 for significant imbalances
Swing Trading (1H+)
Analyze volume delta trends
Detect smart money rotation
Time entries with order flow confirmation
Use Marker 3 for institutional footprints
Advanced Techniques
Cross-Exchange Arbitrage Detection
When price disparities appear between exchanges:
Immediate Opportunity: Price differences > 0.1%
Bot Activity: Rapid convergence patterns
Liquidity Vacuum: One exchange leading others
Divergence Trading Strategies
Volume delta diverging from price direction:
Absorption: Strong hands entering (price down, delta up)
Distribution: Smart money exiting (price up, delta down)
Reversal Setup: Sustained divergence over multiple bars
Institutional Footprint Recognition
Large volume characteristics:
Simultaneous Spikes: Same timestamp across exchanges
TWAP Patterns: Consistent volume over time
Iceberg Orders: Repeated same-size trades
Pine Script v6 Enhancements
Type Safety Improvements
Strict boolean type handling
Explicit type declarations
Enhanced error checking
Performance Optimizations
Improved request.security() function
Better memory management with arrays
Optimized table rendering
Modern Syntax Updates
indicator() instead of study()
Namespaced math functions (math.round())
Typed input functions (input.int(), input.float())
Performance Considerations
System Requirements
Real-time Data: Essential for tape operation
Multiple Security Calls: May impact performance
Array Operations: Memory intensive with high line counts
Table Rendering: CPU usage increases with tape size
Optimization Tips
Reduce tape lines for better performance
Increase volume filter to reduce noise
Disable unused markers
Use text-only coloring for faster rendering

Multi-Timeframe Smart Analysis [Abusuhil]الوصف بالعربي في الاسفل .
📊 Multi-Timeframe Smart Analysis
🇬🇧 ENGLISH DESCRIPTION
Overview
Multi-Timeframe Smart Analysis is a professional trading indicator designed for cryptocurrency and forex markets, combining RSI and MACD with multi-timeframe (MTF) confirmation to generate high-probability trading signals. The indicator provides clear entry points, automatic Fibonacci-based targets, and risk management levels.
Key Features
1. Multi-Timeframe Analysis (MTF)
Analyzes up to 3 higher timeframes simultaneously
Provides trend confirmation from HTF1, HTF2, and HTF3
Real-time dashboard showing current trend status
Optional: Can be disabled to trade based on current timeframe only
2. Smart Signal Generation
Buy Signals: Generated when MACD crosses above signal line with bullish RSI and HTF confirmation
Sell Signals: Generated when MACD crosses below signal line with bearish RSI and HTF confirmation
Anti-spam system: Minimum bars between signals (default: 10 bars)
Optional: Show only last signal to keep chart clean
3. Automatic Risk Management
Entry Line: Displays exact entry price
Stop Loss: Calculated using ATR (default: 1.5x ATR)
Take Profit Levels:
T1: 1.618x ATR (First target)
T2: 2.618x ATR (Second target)
T3: 4.236x ATR (Final target)
4. Visual Dashboard
Shows current timeframe RSI and MACD status
Displays HTF1 and HTF2 trend direction (BULL/BEAR)
Real-time signal status (🟢 BUY / 🔴 SELL / ⚪ WAIT)
Clean, professional interface in top-right corner
5. Customization Options
Multiple signal styles: Label, Triangle, Arrow, Circle
Adjustable signal size: Tiny, Small, Normal, Large
Customizable colors for buy/sell signals
Flexible target extension bars
Toggle all features on/off independently
📋 Recommended Settings by Timeframe
For 1-Minute Chart (Scalping)
HTF1: 5 minutes
HTF2: 15 minutes
HTF3: 1 hour
RSI Length: 14
MACD: 12/26/9
Stop Loss ATR: 1.0
Best for: High-frequency scalping on volatile pairs like BTC/USDT, ETH/USDT
For 5-Minute Chart (Day Trading)
HTF1: 15 minutes
HTF2: 1 hour
HTF3: 4 hours
RSI Length: 14
MACD: 12/26/9
Stop Loss ATR: 1.5
Best for: Intraday trading on major crypto pairs and forex
For 15-Minute Chart (Swing Trading)
HTF1: 1 hour
HTF2: 4 hours
HTF3: 1 day
RSI Length: 14
MACD: 12/26/9
Stop Loss ATR: 1.5
Best for: Short-term swing trades, ideal for crypto and forex
For 1-Hour Chart (Position Trading)
HTF1: 4 hours
HTF2: 1 day
HTF3: 3 days
RSI Length: 14
MACD: 12/26/9
Stop Loss ATR: 2.0
Best for: Medium-term positions, suitable for all markets
For 4-Hour Chart (Swing/Position)
HTF1: 1 day
HTF2: 3 days
HTF3: 1 week
RSI Length: 14
MACD: 12/26/9
Stop Loss ATR: 2.5
Best for: Swing trading with lower frequency, higher accuracy
For Daily Chart (Long-Term)
HTF1: 3 days
HTF2: 1 week
HTF3: 1 month
RSI Length: 14
MACD: 12/26/9
Stop Loss ATR: 3.0
Best for: Position trading and long-term investments
🎯 How to Trade with This Indicator
Entry Rules
For LONG (Buy) Entries:
Wait for 🟢 BUY signal to appear
Verify HTF1 and HTF2 show BULL trend in dashboard
Check RSI is below 70 (not overbought)
Enter at the displayed Entry Line price
Place stop loss at SL level
Set take profit at T1, T2, T3 (scale out)
For SHORT (Sell) Entries:
Wait for 🔴 SELL signal to appear
Verify HTF1 and HTF2 show BEAR trend in dashboard
Check RSI is above 30 (not oversold)
Enter at the displayed Entry Line price
Place stop loss at SL level
Set take profit at T1, T2, T3 (scale out)
Exit Strategy (Recommended)
Conservative Approach:
Close 50% position at T1
Move SL to breakeven
Close 30% at T2
Let 20% run to T3 with trailing stop
Aggressive Approach:
Hold full position to T2
Close 70% at T2
Trail remaining 30% to T3
Quick Scalp:
Close entire position at T1
Re-enter on next signal
⚙️ Settings Guide
Timeframe Settings
Enable Higher Timeframe Analysis: Toggle MTF confirmation on/off
HTF1, HTF2, HTF3: Set your desired higher timeframes
RSI Settings
RSI Length: Period for RSI calculation (default: 14)
RSI Overbought: Upper threshold (default: 70)
RSI Oversold: Lower threshold (default: 30)
Use RSI Filter: Enable/disable RSI confirmation
MACD Settings
Fast Length: Fast EMA period (default: 12)
Slow Length: Slow EMA period (default: 26)
Signal Length: Signal line period (default: 9)
Use MACD Filter: Enable/disable MACD confirmation
Target Settings
Show Price Targets: Toggle target lines on/off
Fib Target 1/2/3: Customize Fibonacci multipliers
Target Extension Bars: How far targets extend (default: 50)
Stop Loss ATR: Stop loss distance multiplier (default: 1.5)
Signal Settings
Show Buy/Sell Signals: Toggle signals independently
Show Only Last Signal: Hide previous signals, show only latest
Signal Style: Choose visual style (Label/Triangle/Arrow/Circle)
Minimum Bars Between Signals: Anti-spam filter (default: 10)
📌 Important Notes
Not a Holy Grail: This indicator is a tool, not a guarantee. Always use proper risk management
Backtest First: Test on historical data before live trading
Combine with Price Action: Use support/resistance levels for additional confirmation
Adjust to Market Conditions: Volatile markets may need wider stops, ranging markets need tighter targets
News Events: Avoid trading during major news releases
Risk Management: Never risk more than 1-2% of your capital per trade
🎓 Best Practices
Start Conservative: Begin with default settings
One Timeframe at a Time: Master one chart before expanding
Journal Your Trades: Track which settings work best for your style
Use Demo Account: Practice before risking real money
Stay Disciplined: Follow your trading plan strictly
🔔 Alert System
The indicator includes built-in alerts:
Buy Signal Alert: Notifies when long opportunity appears
Sell Signal Alert: Notifies when short opportunity appears
To activate alerts:
Click "Create Alert" in TradingView
Select "Multi-Timeframe Smart Analysis"
Choose "Buy Signal" or "Sell Signal"
Set notification preferences
💡 Pro Tips
Confluence Trading: Wait for signals that align with key S/R levels
Trend Trading: In strong trends, prioritize signals in trend direction
Multiple Timeframe Entries: Use HTF for bias, lower TF for precise entry
Partial Profits: Always secure some profit at T1
Trailing Stops: Move SL to breakeven after T1 is hit
⚠️ Risk Disclaimer
Trading cryptocurrencies, forex, and other financial instruments involves substantial risk of loss and is not suitable for all investors. Past performance is not indicative of future results. The indicator provides technical analysis only and should not be considered financial advice. You are solely responsible for your trading decisions. Always conduct your own research and consider consulting with a licensed financial advisor.
📞 Support & Updates
For questions, suggestions, or bug reports, please contact via TradingView messages.
Version: 1.0
Author: Abusuhil
Last Updated: December 2024
📊 التحليل الذكي متعدد الأطر الزمنية
🇸🇦 الوصف بالعربية
نظرة عامة
التحليل الذكي متعدد الأطر الزمنية هو مؤشر تداول احترافي مصمم لأسواق العملات الرقمية والفوركس، يجمع بين مؤشري RSI و MACD مع تأكيد من أطر زمنية أعلى لتوليد إشارات تداول عالية الاحتمالية. يوفر المؤشر نقاط دخول واضحة، أهداف تلقائية مبنية على فيبوناتشي، ومستويات إدارة المخاطر.
المزايا الرئيسية
1. التحليل متعدد الأطر الزمنية (MTF)
يحلل حتى 3 أطر زمنية أعلى في وقت واحد
يوفر تأكيد الاتجاه من HTF1، HTF2، و HTF3
لوحة معلومات فورية تظهر حالة الاتجاه الحالي
اختياري: يمكن تعطيله للتداول بناءً على الإطار الزمني الحالي فقط
2. توليد إشارات ذكية
إشارات الشراء: تُنشأ عندما يعبر MACD فوق خط الإشارة مع RSI صاعد وتأكيد HTF
إشارات البيع: تُنشأ عندما يعبر MACD تحت خط الإشارة مع RSI هابط وتأكيد HTF
نظام مضاد للإزعاج: حد أدنى من الشموع بين الإشارات (افتراضي: 10 شموع)
اختياري: إظهار آخر إشارة فقط للحفاظ على نظافة الشارت
3. إدارة تلقائية للمخاطر
خط الدخول: يعرض سعر الدخول الدقيق
وقف الخسارة: محسوب باستخدام ATR (افتراضي: 1.5x ATR)
مستويات جني الأرباح:
T1: 1.618x ATR (الهدف الأول)
T2: 2.618x ATR (الهدف الثاني)
T3: 4.236x ATR (الهدف النهائي)
4. لوحة معلومات مرئية
تعرض حالة RSI و MACD للإطار الزمني الحالي
تظهر اتجاه HTF1 و HTF2 (صاعد/هابط)
حالة الإشارة الفورية (🟢 شراء / 🔴 بيع / ⚪ انتظار)
واجهة نظيفة واحترافية في الزاوية العلوية اليمنى
5. خيارات التخصيص
أنماط إشارات متعددة: تسمية، مثلث، سهم، دائرة
حجم إشارة قابل للتعديل: صغير جداً، صغير، عادي، كبير
ألوان قابلة للتخصيص لإشارات الشراء/البيع
أشرطة تمديد الهدف مرنة
تبديل جميع الميزات تشغيل/إيقاف بشكل مستقل
📋 الإعدادات الموصى بها حسب الإطار الزمني
لشارت دقيقة واحدة (سكالبينج)
HTF1: 5 دقائق
HTF2: 15 دقيقة
HTF3: 1 ساعة
طول RSI: 14
MACD: 12/26/9
وقف الخسارة ATR: 1.0
الأفضل لـ: السكالبينج عالي التردد على الأزواج المتقلبة مثل BTC/USDT، ETH/USDT
لشارت 5 دقائق (التداول اليومي)
HTF1: 15 دقيقة
HTF2: 1 ساعة
HTF3: 4 ساعات
طول RSI: 14
MACD: 12/26/9
وقف الخسارة ATR: 1.5
الأفضل لـ: التداول اليومي على أزواج العملات الرقمية الرئيسية والفوركس
لشارت 15 دقيقة (التداول المتأرجح)
HTF1: 1 ساعة
HTF2: 4 ساعات
HTF3: 1 يوم
طول RSI: 14
MACD: 12/26/9
وقف الخسارة ATR: 1.5
الأفضل لـ: صفقات التأرجح قصيرة المدى، مثالي للعملات الرقمية والفوركس
لشارت ساعة واحدة (التداول بالمراكز)
HTF1: 4 ساعات
HTF2: 1 يوم
HTF3: 3 أيام
طول RSI: 14
MACD: 12/26/9
وقف الخسارة ATR: 2.0
الأفضل لـ: المراكز متوسطة المدى، مناسب لجميع الأسواق
لشارت 4 ساعات (التأرجح/المراكز)
HTF1: 1 يوم
HTF2: 3 أيام
HTF3: 1 أسبوع
طول RSI: 14
MACD: 12/26/9
وقف الخسارة ATR: 2.5
الأفضل لـ: التداول المتأرجح بتردد أقل ودقة أعلى
للشارت اليومي (طويل المدى)
HTF1: 3 أيام
HTF2: 1 أسبوع
HTF3: 1 شهر
طول RSI: 14
MACD: 12/26/9
وقف الخسارة ATR: 3.0
الأفضل لـ: تداول المراكز والاستثمارات طويلة المدى
🎯 كيفية التداول باستخدام هذا المؤشر
قواعد الدخول
لصفقات الشراء (LONG):
انتظر ظهور إشارة 🟢 شراء
تحقق من أن HTF1 و HTF2 تظهر اتجاه صاعد في لوحة المعلومات
تأكد من أن RSI أقل من 70 (ليس في منطقة التشبع الشرائي)
ادخل عند سعر خط الدخول المعروض
ضع وقف الخسارة عند مستوى SL
اضبط جني الأرباح عند T1، T2، T3 (اخرج تدريجياً)
لصفقات البيع (SHORT):
انتظر ظهور إشارة 🔴 بيع
تحقق من أن HTF1 و HTF2 تظهر اتجاه هابط في لوحة المعلومات
تأكد من أن RSI أعلى من 30 (ليس في منطقة التشبع البيعي)
ادخل عند سعر خط الدخول المعروض
ضع وقف الخسارة عند مستوى SL
اضبط جني الأرباح عند T1، T2، T3 (اخرج تدريجياً)
استراتيجية الخروج (موصى بها)
النهج المحافظ:
أغلق 50% من المركز عند T1
حرك وقف الخسارة إلى نقطة التعادل
أغلق 30% عند T2
دع 20% يعمل حتى T3 مع وقف خسارة متحرك
النهج العدواني:
احتفظ بالمركز الكامل حتى T2
أغلق 70% عند T2
تتبع الـ 30% المتبقية حتى T3
سكالبينج سريع:
أغلق المركز بالكامل عند T1
أعد الدخول عند الإشارة التالية
⚙️ دليل الإعدادات
إعدادات الإطار الزمني
تفعيل تحليل الإطار الزمني الأعلى: تبديل تأكيد MTF تشغيل/إيقاف
HTF1، HTF2، HTF3: اضبط الأطر الزمنية الأعلى المرغوبة
إعدادات RSI
طول RSI: فترة حساب RSI (افتراضي: 14)
RSI في التشبع الشرائي: العتبة العليا (افتراضي: 70)
RSI في التشبع البيعي: العتبة السفلى (افتراضي: 30)
استخدام فلتر RSI: تمكين/تعطيل تأكيد RSI
إعدادات MACD
الطول السريع: فترة المتوسط المتحرك السريع (افتراضي: 12)
الطول البطيء: فترة المتوسط المتحرك البطيء (افتراضي: 26)
طول الإشارة: فترة خط الإشارة (افتراضي: 9)
استخدام فلتر MACD: تمكين/تعطيل تأكيد MACD
إعدادات الأهداف
إظهار أهداف الأسعار: تبديل خطوط الأهداف تشغيل/إيقاف
هدف فيبوناتشي 1/2/3: تخصيص مضاعفات فيبوناتشي
أشرطة تمديد الأهداف: مدى امتداد الأهداف (افتراضي: 50)
وقف الخسارة ATR: مضاعف مسافة وقف الخسارة (افتراضي: 1.5)
إعدادات الإشارات
إظهار إشارات الشراء/البيع: تبديل الإشارات بشكل مستقل
إظهار آخر إشارة فقط: إخفاء الإشارات السابقة، إظهار الأحدث فقط
نمط الإشارة: اختر النمط المرئي (تسمية/مثلث/سهم/دائرة)
الحد الأدنى من الشموع بين الإشارات: فلتر مضاد للإزعاج (افتراضي: 10)
📌 ملاحظات مهمة
ليس الكأس المقدسة: هذا المؤشر أداة، وليس ضماناً. استخدم دائماً إدارة مخاطر مناسبة
اختبار رجعي أولاً: اختبر على البيانات التاريخية قبل التداول المباشر
ادمج مع حركة السعر: استخدم مستويات الدعم/المقاومة لتأكيد إضافي
تكيّف مع ظروف السوق: الأسواق المتقلبة قد تحتاج إلى وقف خسارة أوسع، الأسواق الجانبية تحتاج إلى أهداف أضيق
أحداث الأخبار: تجنب التداول أثناء إصدارات الأخبار الكبرى
إدارة المخاطر: لا تخاطر أبداً بأكثر من 1-2% من رأس مالك لكل صفقة
🎓 أفضل الممارسات
ابدأ بحذر: ابدأ بالإعدادات الافتراضية
إطار زمني واحد في كل مرة: أتقن شارت واحد قبل التوسع
سجل صفقاتك: تتبع أي الإعدادات تعمل بشكل أفضل لأسلوبك
استخدم حساب تجريبي: تدرب قبل المخاطرة بأموال حقيقية
التزم بالانضباط: اتبع خطة تداولك بصرامة
🔔 نظام التنبيهات
يتضمن المؤشر تنبيهات مدمجة:
تنبيه إشارة الشراء: يُعلمك عند ظهور فرصة شراء
تنبيه إشارة البيع: يُعلمك عند ظهور فرصة بيع
لتفعيل التنبيهات:
انقر على "إنشاء تنبيه" في TradingView
اختر "Multi-Timeframe Smart Analysis"
اختر "Buy Signal" أو "Sell Signal"
اضبط تفضيلات الإشعارات
💡 نصائح احترافية
تداول التقاء: انتظر الإشارات التي تتماشى مع مستويات الدعم والمقاومة الرئيسية
تداول الاتجاه: في الاتجاهات القوية، أعط الأولوية للإشارات في اتجاه الترند
مداخل الإطار الزمني المتعدد: استخدم HTF للتحيز، إطار زمني أقل للدخول الدقيق
أرباح جزئية: احفظ دائماً بعض الربح عند T1
وقف خسارة متحرك: حرك وقف الخسارة إلى التعادل بعد الوصول إلى T1
⚠️ إخلاء مسؤولية المخاطر
تداول العملات الرقمية والفوركس وغيرها من الأدوات المالية ينطوي على مخاطر كبيرة للخسارة وليس مناسباً لجميع المستثمرين. الأداء السابق لا يشير إلى النتائج المستقبلية. يوفر المؤشر التحليل الفني فقط ولا ينبغي اعتباره نصيحة مالية. أنت المسؤول الوحيد عن قرارات التداول الخاصة بك. قم دائماً بإجراء بحثك الخاص وفكر في استشارة مستشار مالي مرخص.
📞 الدعم والتحديثات
للأسئلة أو الاقتراحات أو الإبلاغ عن الأخطاء، يرجى التواصل عبر رسائل TradingView.
الإصدار: 1.0
المطور: Abusuhil
آخر تحديث: ديسمبر 2024

TMT Support & Resistance - Hitesh NimjeTMT Support & Resistance - HiteshNimje Indicator
Overview
The TMT Support & Resistance indicator is a professional pivot point analysis tool that automatically calculates and displays key support and resistance levels across multiple timeframe perspectives. It offers various pivot point calculation methods and provides customizable visual elements for comprehensive technical analysis.
Key Features
Pivot Point Calculation Methods
1. Traditional Pivot Points
Standard pivot point calculation using Previous Period High, Low, and Close
Creates P, S1, S2, S3, R1, R2, R3 levels
Most widely used method for day trading and swing trading
2. Fibonacci Pivot Points
Incorporates Fibonacci retracement levels (38.2%, 61.8%)
Uses traditional pivot as base with Fibonacci extensions
Popular among traders following Fibonacci analysis
3. Woodie Pivot Points
Alternative calculation method with different weighting
Emphasizes opening price in calculations
Preferred by some intraday traders
4. Classic Pivot Points
Similar to traditional but with different level calculations
Balanced approach to support/resistance identification
Timeframe Options
* Auto: Automatically selects optimal timeframe based on chart timeframe
Intraday ≤15min → Daily
Intraday >15min → Weekly
Daily → Monthly
* Fixed Timeframes: Daily, Weekly, Monthly, Quarterly, Yearly
* Extended Periods: Biyearly, Triyearly, Quinquennially, Decennially
Level Management System
Support Levels (Blue Colored)
* TMT Support 1 (S1): First major support level
* TMT Support 2 (S2): Second support level
* TMT Support 3 (S3): Third support level
* TMT Support 4 (S4): Fourth support level (Traditional/Camarilla only)
* TMT Support 5 (S5): Fifth support level (Traditional/Camarilla only)
Resistance Levels (Black Colored)
* TMT Resistance 1 (R1): First major resistance level
* TMT Resistance 2 (R2): Second resistance level
* TMT Resistance 3 (R3): Third resistance level
* TMT Resistance 4 (R4): Fourth resistance level (Traditional/Camarilla only)
* TMT Resistance 5 (R5): Fifth resistance level (Traditional/Camarilla only)
Central Pivot (Orange Colored)
* Pivot Point (P): Central price level used for S/R calculations
Customization Options
Display Settings
* Show Labels: Toggle pivot level identification labels
* Show Prices: Display actual price values next to levels
* Labels Position: Choose between Left or Right positioning
* Line Width: Adjustable thickness (1-100 pixels) for all pivot lines
Data Source Options
* Use Daily-based Values:
ON: Uses official daily OHLC values for calculations
OFF: Uses intraday data with extended hours consideration
* Number of Pivots Back: Historical pivot display (1-200 levels)
Color Customization
* Individual color selection for each support/resistance level
* Default colors: Supports (Blue), Resistances (Black), Pivot (Orange)
* Full color picker integration for all levels
Technical Features
Smart Display Logic
* Intraday Charts: Automatically uses daily-based calculations when intraday data is insufficient
* Multi-timeframe Compatibility: Adapts to chart timeframe and pivot timeframe differences
* Extended Hours Handling: Incorporates extended trading hours when enabled on chart
Dynamic Level Management
* Real-time Updates: Levels update as new data becomes available
* Historical Tracking: Maintains configurable number of historical pivot periods
* Automatic Cleanup: Removes old pivot graphics when limit is exceeded
Visual Elements
* Time-based Lines: Lines extend across full time periods for clear visual reference
* Price Labels: Contextual information showing level names and prices
* Professional Styling: Clean, professional appearance suitable for any trading style
Use Cases
Day Trading Applications
* Session Management: Use daily pivots for intraday trading decisions
* Range Trading: Camarilla levels excellent for range-bound strategies
* Breakout Confirmation: Use pivot breaks as entry/exit signals
Swing Trading Applications
* Weekly/Monthly Pivots: Identify key levels for multi-day positions
* Trend Analysis: Track how price interacts with higher timeframe pivots
* Risk Management: Set stop-losses and take-profits at pivot levels
Long-term Trading Applications
* Quarterly/Yearly Pivots: Major institutional levels for position trading
* Support/Resistance Maps: Create comprehensive price level roadmap
* Market Structure Analysis: Understand price behavior around key levels
Benefits for Traders
Professional Analysis
* Multiple Methodologies: Choose pivot calculation that matches trading style
* Timeframe Flexibility: Analyze from multiple temporal perspectives
* Historical Context: See how price has historically responded to pivot levels
Risk Management
* Level Identification: Clear visual reference for stop-loss placement
* Position Sizing: Use pivot distances for risk/reward calculations
* Entry Timing: Identify optimal entry points near support/resistance
Market Understanding
* Psychological Levels: Understand where market participants react
* Volume Confirmation: Cross-reference pivot levels with volume data
* Trend Continuation: Identify pivot levels that may continue or reverse trends
Technical Specifications
* Pine Script Version: 6
* Overlay: True (displays on price chart)
* Performance: Optimized for up to 200 historical pivot periods
* Compatibility: All trading instruments and timeframes
* Data Source: OHLC-based pivot calculations with security function integration
Trading Strategy Integration
1. Support/Resistance Trading: Enter trades at S1/R1 with stops beyond S2/R2
2. Pivot Bounce Strategy: Trade bounces from established pivot levels
3. Range Trading: Use Camarilla pivots for tight range strategies
4. Breakout Strategy: Enter breakouts with confirmation from pivot breaks
5. Multiple Timeframe Analysis: Combine daily, weekly, and monthly pivots for comprehensive analysis
This indicator serves as a comprehensive support and resistance analysis tool, providing traders with institutional-quality pivot point analysis across multiple calculation methods and timeframes. It combines professional-grade pivot point calculations with intuitive customization options, making it suitable for traders of all experience levels and trading styles.
TRADING DISCLAIMER
RISK WARNING
Trading involves substantial risk of loss and is not suitable for all investors. Past performance is not indicative of future results. You should carefully consider whether trading is suitable for you in light of your circumstances, knowledge, and financial resources.
NO FINANCIAL ADVICE
This indicator is provided for educational and informational purposes only. It does not constitute:
* Financial advice or investment recommendations
* Buy/sell signals or trading signals
* Professional investment advice
* Legal, tax, or accounting guidance
LIMITATIONS AND DISCLAIMERS
Technical Analysis Limitations
* Pivot points are mathematical calculations based on historical price data
* No guarantee of accuracy of price levels or calculations
* Markets can and do behave irrationally for extended periods
* Past performance does not guarantee future results
* Technical analysis should be used in conjunction with fundamental analysis
Data and Calculation Disclaimers
* Calculations are based on available price data at the time of calculation
* Data quality and availability may affect accuracy
* Pivot levels may differ when calculated on different timeframes
* Gaps and irregular market conditions may cause level failures
* Extended hours trading may affect intraday pivot calculations
Market Risks
* Extreme market volatility can invalidate all technical levels
* News events, economic announcements, and market manipulation can cause gaps
* Liquidity issues may prevent execution at calculated levels
* Currency fluctuations, inflation, and interest rate changes affect all levels
* Black swan events and market crashes cannot be predicted by technical analysis
USER RESPONSIBILITIES
Due Diligence
* You are solely responsible for your trading decisions
* Conduct your own research before using this indicator
* Verify calculations with multiple sources before trading
* Consider multiple timeframes and confirm levels with other technical tools
* Never rely solely on one indicator for trading decisions
Risk Management
* Always use proper risk management and position sizing
* Set appropriate stop-losses for all positions
* Never risk more than you can afford to lose
* Consider the inherent risks of leverage and margin trading
* Diversify your portfolio and trading strategies
Professional Consultation
* Consult with qualified financial advisors before trading
* Consider your tax obligations and legal requirements
* Understand the regulations in your jurisdiction
* Seek professional advice for complex trading strategies
LIMITATION OF LIABILITY
Indemnification
The creator and distributor of this indicator shall not be liable for:
* Any trading losses, whether direct or indirect
* Inaccurate or delayed price data
* System failures or technical malfunctions
* Loss of data or profits
* Interruption of service or connectivity issues
No Warranty
This indicator is provided "as is" without warranties of any kind:
* No guarantee of accuracy or completeness
* No warranty of uninterrupted or error-free operation
* No warranty of merchantability or fitness for a particular purpose
* The software may contain bugs or errors
Maximum Liability
In no event shall the liability exceed the purchase price (if any) paid for this indicator. This limitation applies regardless of the theory of liability, whether contract, tort, negligence, or otherwise.
REGULATORY COMPLIANCE
Jurisdiction-Specific Risks
* Regulations vary by country and region
* Some jurisdictions prohibit or restrict certain trading strategies
* Tax implications differ based on your location and trading frequency
* Commodity futures and options trading may have additional requirements
* Currency trading may be regulated differently than stock trading
Professional Trading
* If you are a professional trader, ensure compliance with all applicable regulations
* Adhere to fiduciary duties and best execution requirements
* Maintain required records and reporting
* Follow market abuse regulations and insider trading laws
TECHNICAL SPECIFICATIONS
Data Sources
* Calculations based on TradingView data feeds
* Data accuracy depends on broker and exchange reporting
* Historical data may be subject to adjustments and corrections
* Real-time data may have delays depending on data providers
Software Limitations
* Internet connectivity required for proper operation
* Software updates may change calculations or functionality
* TradingView platform dependencies may affect performance
* Third-party integrations may introduce additional risks
MONEY MANAGEMENT RECOMMENDATIONS
Conservative Approach
* Risk only 1-2% of capital per trade
* Use position sizing based on volatility
* Maintain adequate cash reserves
* Avoid over-leveraging accounts
Portfolio Management
* Diversify across multiple strategies
* Don't put all capital into one approach
* Regularly review and adjust trading strategies
* Maintain detailed trading records
FINAL LEGAL NOTICES
Acceptance of Terms
* By using this indicator, you acknowledge that you have read and understood this disclaimer
* You agree to assume all risks associated with trading
* You confirm that you are legally permitted to trade in your jurisdiction
Updates and Changes
* This disclaimer may be updated without notice
* Continued use constitutes acceptance of any changes
* It is your responsibility to stay informed of updates
Governing Law
* This disclaimer shall be governed by the laws of the jurisdiction where the indicator was created
* Any disputes shall be resolved in the appropriate courts
* Severability clause: If any part of this disclaimer is invalid, the remainder remains enforceable
REMEMBER: THERE ARE NO GUARANTEES IN TRADING. THE MAJORITY OF RETAIL TRADERS LOSE MONEY. TRADE AT YOUR OWN RISK.
Contact Information:
* Creator: Hitesh_Nimje
* Phone: Contact@8087192915
* Source: Thought Magic Trading
© HiteshNimje - All Rights Reserved
This disclaimer should be prominently displayed whenever the indicator is shared, sold, or distributed to ensure users are fully aware of the risks and limitations involved in trading.

RED-E Institutional Flow Tracker ProRED-E Institutional Flow Tracker Pro
A histogram-based institutional activity detector for swing traders and options traders. Identifies institutional buying/selling pressure through volume analysis, money flow calculations, and manipulation detection algorithms.
═══════════════════════════════════════════════════════════════════════════════
OVERVIEW
═══════════════════════════════════════════════════════════════════════════════
This indicator addresses two critical challenges in swing trading:
1. Exiting profitable positions prematurely due to normal market volatility
2. Holding positions during periods of market manipulation
The histogram display provides clear visual signals (BUY/HOLD/SELL) with educational tooltips explaining why each signal appeared and how to trade it.
═══════════════════════════════════════════════════════════════════════════════
ORIGINALITY & METHODOLOGY
═══════════════════════════════════════════════════════════════════════════════
Built from scratch using Pine Script v6, this indicator combines multiple analytical methods into a unified histogram system:
**Core Detection Methods:**
- **Dollar Volume Analysis** - Multiplies price by volume to identify institutional-sized trades. Default threshold: 3x average dollar volume over 20 periods.
- **Smart Money Flow Detection** - Combines three simultaneous conditions: unusual volume (1.5x+ average), large order size (3x+ average dollar volume), and directional price movement. All three must occur on the same bar for confirmation.
- **Money Flow Index Integration** - 14-period volume-weighted momentum indicator. Calculated as: typical price (HLC3) × volume, separated into positive flow (up bars) and negative flow (down bars), converted to 0-100 scale.
- **Manipulation Detection Algorithm** - Identifies suspicious patterns where volume spikes dramatically (>1.5x threshold) but price moves minimally (<0.5% volatility). This pattern is characteristic of spoofing, layering, and wash trading.
- **Market Regime Classification** - Uses Money Flow Index combined with flow strength to classify market state as Bullish (MFI >50 and positive flow), Bearish (MFI <50 and negative flow), or Neutral.
**Histogram Calculation:**
Formula: (Price Change % × Volume Ratio) × (1.5x multiplier if large order detected)
Smoothed with 3-period EMA for clean visualization
Values automatically scaled for optimal display
**21-Period Moving Average:**
Simple moving average of histogram values provides trend direction confirmation. Crossovers signal momentum shifts.
═══════════════════════════════════════════════════════════════════════════════
HOW IT WORKS - TECHNICAL DETAILS
═══════════════════════════════════════════════════════════════════════════════
**1. Volume Analysis Foundation**
- 50-period SMA of volume establishes baseline
- Current volume compared to baseline creates Volume Ratio
- Unusual volume threshold (default 1.5x) flags institutional interest
**2. Money Flow Index (14-period default)**
- Typical price = (High + Low + Close) / 3
- Raw Money Flow = Typical Price × Volume
- Positive Flow = Raw Money Flow when price up
- Negative Flow = Raw Money Flow when price down
- MFI = 100 -
**3. Large Order Detection**
- Dollar Volume = Close Price × Volume
- 20-period average establishes baseline
- Orders exceeding 3x baseline flagged as institutional
**4. Smart Money Logic**
- Buying Signal: Positive price change AND large order AND volume >1.5x average (all simultaneous)
- Selling Signal: Negative price change AND large order AND volume >1.5x average (all simultaneous)
- Must occur on same bar for confirmation
**5. Flow Magnitude Tracking**
- Dollar volume tracked cumulatively
- Automatically resets daily at market open
- Formatted in readable units: K (thousands), M (millions), B (billions), T (trillions)
- Displayed in dashboard for easy monitoring
**6. Signal Classification**
- Strong Buy: Histogram >0.3 AND bullish regime AND unusual volume
- Buy: Histogram >0.15 AND bullish regime
- Hold: Histogram between ±0.15 OR neutral regime
- Sell: Histogram <-0.15 AND bearish regime
- Strong Sell: Histogram <-0.3 AND bearish regime AND unusual volume
**7. Manipulation Detection**
- Triggers when: Volume Ratio > threshold AND price volatility < 0.5%
- This pattern suggests large volume without corresponding price impact
- Common in spoofing (fake orders), layering (multiple false orders), and wash trading
═══════════════════════════════════════════════════════════════════════════════
HISTOGRAM DISPLAY & INTERPRETATION
═══════════════════════════════════════════════════════════════════════════════
**Color-Coded Bars:**
- **Bright Green** - Strong institutional buying (>0.3 momentum + bullish regime + unusual volume)
- **Light Green** - Institutional buying (>0.15 momentum + bullish regime)
- **Gray** - Neutral/Hold zone (±0.15 momentum or neutral regime)
- **Light Red** - Institutional selling (<-0.15 momentum + bearish regime)
- **Bright Red** - Strong institutional selling (<-0.3 momentum + bearish regime + unusual volume)
**Visual Signals:**
- **BUY labels** - Appear above bright green bars with detailed tooltip
- **SELL labels** - Appear below bright red bars with detailed tooltip
- **HOLD labels** - Appear on most recent bar during consolidation with educational tooltip
- **Yellow warning dots (⚠)** - Mark manipulation periods at zero line with explanation tooltip
- **Blue 21-period MA** - Shows overall trend direction
**Interactive Tooltips:**
Hover over any signal to see:
- Why the signal appeared (exact metrics)
- What the data shows (momentum, MFI, volume values)
- How to trade it (entry, exit, position sizing)
- Risk management recommendations
**Plot Style Options:**
Users can choose from 5 display styles:
- Columns (default) - Traditional histogram bars
- Area - Filled area chart
- Line - Simple line chart
- Step Line - Step-style line
- Histogram - Alternative histogram style
═══════════════════════════════════════════════════════════════════════════════
DASHBOARD METRICS EXPLAINED
═══════════════════════════════════════════════════════════════════════════════
12-row real-time dashboard displays:
**Current Flow** - Institutional money flow for current bar (M/B/T units)
**Daily Flow** - Cumulative activity since market open (resets daily)
**Flow Strength** - Intensity percentage (0-100%)
- >70% = Extreme pressure
- 40-70% = Moderate activity
- <40% = Weak/absent activity
**Money Flow Index** - Volume-weighted momentum (0-100 scale)
- >60 = Strong buying pressure
- 40-60 = Neutral/mixed
- <40 = Strong selling pressure
**Volume Ratio** - Current vs 50-day average
- >2.0x = Highly unusual
- 1.5-2.0x = Unusual
- <1.5x = Normal
**Market Regime** - Current classification
- Bullish: MFI >50 AND histogram >0
- Bearish: MFI <50 AND histogram <0
- Neutral: All other conditions
**Activity Status** - Real-time assessment
- HEAVY BUYING: Unusual volume + buying + MFI >60
- BUYING: Large orders + positive movement
- HEAVY SELLING: Unusual volume + selling + MFI <40
- SELLING: Large orders + negative movement
- NEUTRAL: No significant activity
**Unusual Volume** - Binary alert when exceeds threshold
**Large Orders** - Binary alert when dollar volume >3x average
**Manipulation Warning** - Binary alert for suspicious patterns
**Swing Signal** - Primary recommendation
- HOLD LONG: Bullish regime + Flow Strength >60%
- HOLD SHORT: Bearish regime + Flow Strength >60%
- CAUTION: Manipulation detected
- MONITOR: All other conditions
═══════════════════════════════════════════════════════════════════════════════
HOW TO USE FOR SWING TRADING
═══════════════════════════════════════════════════════════════════════════════
**ENTRY CONFIRMATION (Long Positions):**
Wait for multiple confirmations:
1. Histogram shows bright green bars
2. Histogram crosses above 21-period MA
3. Flow Strength >60%
4. Dashboard shows "BUYING" or "HEAVY BUYING"
5. Volume Ratio >1.5x
6. No yellow manipulation warnings
7. Regime shows "BULLISH"
**HOLDING POSITIONS (Primary Use Case):**
The indicator's strength is helping traders stay in winning trades. Continue holding when:
- Dashboard displays "HOLD LONG" or "HOLD SHORT"
- Histogram bars remain same color as position direction
- Histogram stays on correct side of 21-period MA
- Daily Flow continues trending in your direction
- Market regime supports position
- No "CAUTION" signals appear
This prevents premature exits during normal volatility when institutions are still supporting the move.
**EXIT SIGNALS:**
Consider closing positions when:
- Histogram crosses 21-period MA against position
- Histogram color changes from green to red (or vice versa)
- Dashboard changes to "CAUTION"
- Yellow manipulation warnings appear
- Market regime flips
- Flow Strength drops below 40%
**ENTRY CONFIRMATION (Short Positions):**
Wait for multiple confirmations:
1. Histogram shows bright red bars
2. Histogram crosses below 21-period MA
3. Flow Strength >60%
4. Dashboard shows "SELLING" or "HEAVY SELLING"
5. Volume Ratio >1.5x
6. No manipulation warnings
7. Regime shows "BEARISH"
═══════════════════════════════════════════════════════════════════════════════
CUSTOMIZATION OPTIONS
═══════════════════════════════════════════════════════════════════════════════
**Flow Detection Settings:**
- Unusual Volume Threshold (1.0-5.0x, default 1.5x)
- Large Order Multiplier (2.0-10.0x, default 3.0x)
- Flow Analysis Period (5-50 bars, default 14)
**Histogram Display:**
- Histogram Style (5 options: Columns/Area/Line/Step/Histogram)
- Histogram Width (1-10, default 4)
**Moving Average:**
- Show 21-Period MA (toggle)
- MA Line Color (customizable)
- MA Line Width (1-5, default 2)
**Visual Settings:**
- Show Buy/Hold/Sell Labels (toggle)
- Label Size (Tiny/Small/Normal/Large/Huge)
- Label Distance from Bars (0.1-2.0x, prevents overlap)
- Show Manipulation Warnings (toggle)
- Show Watermark (toggle)
**Dashboard:**
- Position (4 corners)
- Size (Small/Normal/Large)
- Background Color (fully customizable)
- Border Color (fully customizable)
**Alerts:**
- Toggle institutional activity alerts
- Three types: Strong Buy, Strong Sell, Manipulation Detection
═══════════════════════════════════════════════════════════════════════════════
RECOMMENDED SETTINGS BY TRADING STYLE
═══════════════════════════════════════════════════════════════════════════════
**Day Trading (15min-1H):**
- Volume Threshold: 1.3x
- Large Order Multiplier: 2.5x
- Flow Period: 7-10
- Label Distance: 0.3-0.4x
**Swing Trading (4H-Daily) - DEFAULT:**
- Volume Threshold: 1.5x
- Large Order Multiplier: 3.0x
- Flow Period: 14
- Label Distance: 0.5x
**Position Trading (Daily-Weekly):**
- Volume Threshold: 2.0x
- Large Order Multiplier: 5.0x
- Flow Period: 21
- Label Distance: 0.7-1.0x
═══════════════════════════════════════════════════════════════════════════════
BEST MARKETS & TIMEFRAMES
═══════════════════════════════════════════════════════════════════════════════
**Optimal Performance:**
- Timeframes: 1-hour, 4-hour, Daily
- Markets: Liquid stocks and ETFs (avg volume >1M shares/day)
- Market Cap: >$500M (ensures institutional participation)
- Examples: SPY, QQQ, AAPL, MSFT, NVDA, TSLA, major sector ETFs
**Less Effective:**
- Penny stocks (<$500M market cap)
- Low-volume securities
- Cryptocurrency (different volume dynamics)
- Timeframes below 15 minutes (excessive noise)
═══════════════════════════════════════════════════════════════════════════════
EDUCATIONAL FEATURES
═══════════════════════════════════════════════════════════════════════════════
**Interactive Learning:**
Every signal includes a hover tooltip that explains:
- **Why** - The specific conditions that triggered the signal
- **What** - The exact metric values (momentum, MFI, volume)
- **How** - Specific trading actions to take
- **When** - Exit conditions to monitor
- **Risk** - Management recommendations
**Example Tooltips:**
**BUY Signal:** "Institutions actively accumulating. Momentum: X.XX | MFI: XX | Volume: X.Xx avg. Large orders detected. Consider LONG positions or CALL options. Place stops below support."
**HOLD Signal:** "Consolidation phase. No clear direction. HOLD profitable positions. DO NOT enter new trades. Many traders exit too early during consolidation - institutions accumulate before next move."
**Manipulation Warning:** "High volume with minimal price movement. Possible spoofing, layering, or wash trading. STAY OUT. Tighten stops. Expect whipsaw. Wait for warning to clear."
═══════════════════════════════════════════════════════════════════════════════
LIMITATIONS & DISCLOSURES
═══════════════════════════════════════════════════════════════════════════════
**What This Indicator DOES:**
✓ Analyzes publicly available price and volume data
✓ Identifies patterns consistent with institutional activity
✓ Detects suspicious volume/price relationships
✓ Provides statistical money flow analysis
✓ Helps traders hold through normal volatility
**What This Indicator DOES NOT DO:**
✗ Access external APIs or institutional order flow data
✗ Track actual institutional orders (infers from patterns)
✗ Guarantee profitable trades
✗ Replace risk management
✗ Work reliably on illiquid securities
✗ Provide financial advice
**Technical Limitations:**
- Uses confirmed bar data only (no repainting)
- Requires minimum 50 bars for volume baseline
- Daily Flow resets at market open
- Manipulation detection can have false positives during low liquidity
- Label positioning may overlap on extreme values
**Trading Disclaimers:**
- Infers institutional activity through statistical analysis
- Should complement, not replace, fundamental analysis
- Past performance does not guarantee future results
- Always use proper position sizing and stop losses
- Not a registered investment advisor
**Risk Warning:**
Options trading carries substantial risk. This indicator is provided for educational purposes. Users should conduct due diligence and consult licensed professionals before trading.
═══════════════════════════════════════════════════════════════════════════════
ALERT CONDITIONS
═══════════════════════════════════════════════════════════════════════════════
Three built-in alert types:
1. **Strong Buy Signal** - Bright green bars appear (>0.3 momentum + bullish regime + unusual volume)
2. **Strong Sell Signal** - Bright red bars appear (<-0.3 momentum + bearish regime + unusual volume)
3. **Manipulation Detected** - Suspicious volume/price patterns occur
To enable:
- Click three dots next to indicator name
- Select "Create Alert"
- Choose alert condition
- Configure notifications
- Set frequency to "Once Per Bar Close"
═══════════════════════════════════════════════════════════════════════════════
TECHNICAL SPECIFICATIONS
═══════════════════════════════════════════════════════════════════════════════
- **Pine Script Version:** v6
- **Type:** Oscillator (separate pane)
- **Repainting:** None - uses confirmed bar data only
- **Lookahead Bias:** None
- **Max Bars Back:** 500
- **Computational Load:** Low to moderate
- **Bar Replay Compatible:** Yes
═══════════════════════════════════════════════════════════════════════════════
VERSION HISTORY
═══════════════════════════════════════════════════════════════════════════════
**v1.0** (Initial Release)
- Histogram-based institutional momentum display
- 5 customizable plot styles
- 12-metric comprehensive dashboard
- Flow magnitude tracking (M/B/T units)
- 21-period moving average overlay
- Manipulation detection algorithm
- Educational tooltip system on all signals
- BUY/HOLD/SELL label system with positioning
- Market regime classification
- Three alert conditions
- Fully customizable dashboard (size, colors, position)
═══════════════════════════════════════════════════════════════════════════════
CREDITS
═══════════════════════════════════════════════════════════════════════════════
Developed from scratch using Pine Script v6 and standard TradingView built-in functions. No code copied from other scripts. Methodology combines classical volume analysis with modern institutional flow detection.
═══════════════════════════════════════════════════════════════════════════════
This indicator helps swing traders answer: "Should I hold or exit?" By analyzing institutional activity and warning of manipulation, it provides the framework to stay in winning trades while protecting against adverse conditions.
Published open-source to contribute to the TradingView community.
Questions or feedback? Leave a comment below.
═══════════════════════════════════════════════════════════════════════════════
Disclaimer: Provided "as-is" without warranty. Use at your own risk. Past performance does not guarantee future results.

Kernel Market Dynamics [WFO - MAB]Kernel Market Dynamics
⚛️ CORE INNOVATION: KERNEL-BASED DISTRIBUTION ANALYSIS
The Kernel Market Dynamics system represents a fundamental departure from traditional technical indicators. Rather than measuring price levels, momentum, or oscillator extremes, KMD analyzes the statistical distribution of market returns using advanced kernel methods from machine learning theory. This allows the system to detect when market behavior has fundamentally changed—not just when price has moved, but when the underlying probability structure has shifted.
The Distribution Hypothesis:
Traditional indicators assume markets move in predictable patterns. KMD assumes something more profound: markets exist in distinct distributional regimes , and profitable trading opportunities emerge during regime transitions . When the distribution of recent returns diverges significantly from the historical baseline, the market is restructuring—and that's when edge exists.
Maximum Mean Discrepancy (MMD):
At the heart of KMD lies a sophisticated statistical metric called Maximum Mean Discrepancy. MMD measures the distance between two probability distributions by comparing their representations in a high-dimensional feature space created by a kernel function.
The Mathematics:
Given two sets of normalized returns:
• Reference period (X) : Historical baseline (default 100 bars)
• Test period (Y) : Recent behavior (default 20 bars)
MMD is calculated as:
MMD² = E + E - 2·E
Where:
• E = Expected kernel similarity within reference period
• E = Expected kernel similarity within test period
• E = Expected cross-similarity between periods
When MMD is low : Test period behaves like reference (stable regime)
When MMD is high : Test period diverges from reference (regime shift)
The final MMD value is smoothed with EMA(5) to reduce single-bar noise while maintaining responsiveness to genuine distribution changes.
The Kernel Functions:
The kernel function defines how similarity is measured. KMD offers four mathematically distinct kernels, each with different properties:
1. RBF (Radial Basis Function / Gaussian):
• Formula: k(x,y) = exp(-d² / (2·σ²·scale))
• Properties: Most sensitive to distribution changes, smooth decision boundaries
• Best for: Clean data, clear regime shifts, low-noise markets
• Sensitivity: Highest - detects subtle changes
• Use case: Stock indices, major forex pairs, trending environments
2. Laplacian:
• Formula: k(x,y) = exp(-|d| / σ)
• Properties: Medium sensitivity, robust to moderate outliers
• Best for: Standard market conditions, balanced noise/signal
• Sensitivity: Medium - filters minor fluctuations
• Use case: Commodities, standard timeframes, general trading
3. Cauchy (Default - Most Robust):
• Formula: k(x,y) = 1 / (1 + d²/σ²)
• Properties: Heavy-tailed, highly robust to outliers and spikes
• Best for: Noisy markets, choppy conditions, crypto volatility
• Sensitivity: Lower - only major distribution shifts trigger
• Use case: Cryptocurrencies, illiquid markets, volatile instruments
4. Rational Quadratic:
• Formula: k(x,y) = (1 + d²/(2·α·σ²))^(-α)
• Properties: Tunable via alpha parameter, mixture of RBF kernels
• Alpha < 1.0: Heavy tails (like Cauchy)
• Alpha > 3.0: Light tails (like RBF)
• Best for: Adaptive use, mixed market conditions
• Use case: Experimental optimization, regime-specific tuning
Bandwidth (σ) Parameter:
The bandwidth controls the "width" of the kernel, determining sensitivity to return differences:
• Low bandwidth (0.5-1.5) : Narrow kernel, very sensitive
- Treats small differences as significant
- More MMD spikes, more signals
- Use for: Scalping, fast markets
• Medium bandwidth (1.5-3.0) : Balanced sensitivity (recommended)
- Filters noise while catching real shifts
- Professional-grade signal quality
- Use for: Day/swing trading
• High bandwidth (3.0-10.0) : Wide kernel, less sensitive
- Only major distribution changes register
- Fewer, stronger signals
- Use for: Position trading, trend following
Adaptive Bandwidth:
When enabled (default ON), bandwidth automatically scales with market volatility:
Effective_BW = Base_BW × max(0.5, min(2.0, 1 / volatility_ratio))
• Low volatility → Tighter bandwidth (0.5× base) → More sensitive
• High volatility → Wider bandwidth (2.0× base) → Less sensitive
This prevents signal flooding during wild markets and avoids signal drought during calm periods.
Why Kernels Work:
Kernel methods implicitly map data to infinite-dimensional space where complex, nonlinear patterns become linearly separable. This allows MMD to detect distribution changes that simpler statistics (mean, variance) would miss. For example:
• Same mean, different shape : Traditional metrics see nothing, MMD detects shift
• Same volatility, different skew : Oscillators miss it, MMD catches it
• Regime rotation : Price unchanged, but return distribution restructured
The kernel captures the entire distributional signature —not just first and second moments.
🎰 MULTI-ARMED BANDIT FRAMEWORK: ADAPTIVE STRATEGY SELECTION
Rather than forcing one strategy on all market conditions, KMD implements a Multi-Armed Bandit (MAB) system that learns which of seven distinct strategies performs best and dynamically selects the optimal approach in real-time.
The Seven Arms (Strategies):
Each arm represents a fundamentally different trading logic:
ARM 0 - MMD Regime Shift:
• Logic: Distribution divergence with directional bias
• Triggers: MMD > threshold AND direction_bias confirmed AND velocity > 5%
• Philosophy: Trade the regime transition itself
• Best in: Volatile shifts, breakout moments, crisis periods
• Weakness: False alarms in choppy consolidation
ARM 1 - Trend Following:
• Logic: Aligned EMAs with strong ADX
• Triggers: EMA(9) > EMA(21) > EMA(50) AND ADX > 25
• Philosophy: Ride established momentum
• Best in: Strong trending regimes, directional markets
• Weakness: Late entries, whipsaws at reversals
ARM 2 - Breakout:
• Logic: Bollinger Band breakouts with volume
• Triggers: Price crosses BB outer band AND volume > 1.2× average
• Philosophy: Capture volatility expansion events
• Best in: Range breakouts, earnings, news events
• Weakness: False breakouts in ranging markets
ARM 3 - RSI Mean Reversion:
• Logic: RSI extremes with reversal confirmation
• Triggers: RSI < 30 with uptick OR RSI > 70 with downtick
• Philosophy: Fade overbought/oversold extremes
• Best in: Ranging markets, mean-reverting instruments
• Weakness: Fails in strong trends, catches falling knives
ARM 4 - Z-Score Statistical Reversion:
• Logic: Price deviation from 50-period mean
• Triggers: Z-score < -2 (oversold) OR > +2 (overbought) with reversal
• Philosophy: Statistical bounds reversion
• Best in: Stable volatility regimes, pairs trading
• Weakness: Trend continuation through extremes
ARM 5 - ADX Momentum:
• Logic: Strong directional movement with acceleration
• Triggers: ADX > 30 with DI+ or DI- strengthening
• Philosophy: Momentum begets momentum
• Best in: Trending with increasing velocity
• Weakness: Late exits, momentum exhaustion
ARM 6 - Volume Confirmation:
• Logic: OBV trend + volume spike + candle direction
• Triggers: OBV > EMA(20) AND volume > average AND bullish candle
• Philosophy: Follow institutional money flow
• Best in: Liquid markets with reliable volume
• Weakness: Manipulated volume, thin markets
Q-Learning with Rewards:
Each arm maintains a Q-value representing its expected reward. After every bar, the system calculates a reward based on the arm's signal and actual price movement:
Reward Calculation:
If arm signaled LONG:
reward = (close - close ) / close
If arm signaled SHORT:
reward = -(close - close ) / close
If arm signaled NEUTRAL:
reward = 0
Penalty multiplier: If loss > 0.5%, reward × 1.3 (punish big losses harder)
Q-Value Update (Exponential Moving Average):
Q_new = Q_old + α × (reward - Q_old)
Where α (learning rate, default 0.08) controls adaptation speed:
• Low α (0.01-0.05): Slow, stable learning
• Medium α (0.06-0.12): Balanced (recommended)
• High α (0.15-0.30): Fast, reactive learning
This gradually shifts Q-values toward arms that generate positive returns and away from losing arms.
Arm Selection Algorithms:
KMD offers four mathematically distinct selection strategies:
1. UCB1 (Upper Confidence Bound) - Recommended:
Formula: Select arm with max(Q_i + c·√(ln(t)/n_i))
Where:
• Q_i = Q-value of arm i
• c = exploration constant (default 1.5)
• t = total pulls across all arms
• n_i = pulls of arm i
Philosophy: Balance exploitation (use best arm) with exploration (try uncertain arms). The √(ln(t)/n_i) term creates an "exploration bonus" that decreases as an arm gets more pulls, ensuring all arms get sufficient testing.
Theoretical guarantee: Logarithmic regret bound - UCB1 provably converges to optimal arm selection over time.
2. UCB1-Tuned (Variance-Aware UCB):
Formula: Select arm with max(Q_i + √(ln(t)/n_i × min(0.25, V_i + √(2·ln(t)/n_i))))
Where V_i = variance of rewards for arm i
Philosophy: Incorporates reward variance into exploration. Arms with high variance (unpredictable) get less exploration bonus, focusing effort on stable performers.
Better bounds than UCB1 in practice, slightly more conservative exploration.
3. Epsilon-Greedy (Simple Random):
Algorithm:
With probability ε: Select random arm (explore)
With probability 1-ε: Select highest Q-value arm (exploit)
Default ε = 0.10 (10% exploration, 90% exploitation)
Philosophy: Simplest algorithm, easy to understand. Random exploration ensures all arms stay updated but may waste time on clearly bad arms.
4. Thompson Sampling (Bayesian):
The most sophisticated selection algorithm, using true Bayesian probability.
Each arm maintains Beta distribution parameters:
• α (alpha) = successes + 1
• β (beta) = failures + 1
Selection Process:
1. Sample θ_i ~ Beta(α_i, β_i) for each arm using Marsaglia-Tsang Gamma sampler
2. Select arm with highest sample: argmax_i(θ_i)
3. After reward, update:
- If reward > 0: α += |reward| × 100 (increment successes)
- If reward < 0: β += |reward| × 100 (increment failures)
Why Thompson Sampling Works:
The Beta distribution naturally represents uncertainty about an arm's true win rate. Early on with few trials, the distribution is wide (high uncertainty), leading to more exploration. As evidence accumulates, it narrows around the true performance, naturally shifting toward exploitation.
Unlike UCB which uses deterministic confidence bounds, Thompson Sampling is probabilistic—it samples from the posterior distribution of each arm's success rate, providing automatic exploration/exploitation balance without tuning.
Comparison:
• UCB1: Deterministic, guaranteed regret bounds, requires tuning exploration constant
• Thompson: Probabilistic, natural exploration, no tuning required, best empirical performance
• Epsilon-Greedy: Simplest, consistent exploration %, less efficient
• UCB1-Tuned: UCB1 + variance awareness, best for risk-averse
Exploration Constant (c):
For UCB algorithms, this multiplies the exploration bonus:
• Low c (0.5-1.0): Strongly prefer proven arms, rare exploration
• Medium c (1.2-1.8): Balanced (default 1.5)
• High c (2.0-3.0): Frequent exploration, diverse arm usage
Higher exploration constant in volatile/unstable markets, lower in stable trending environments.
🔬 WALK-FORWARD OPTIMIZATION: PREVENTING OVERFITTING
The single biggest problem in algorithmic trading is overfitting—strategies that look amazing in backtest but fail in live trading because they learned noise instead of signal. KMD's Walk-Forward Optimization system addresses this head-on.
How WFO Works:
The system divides time into repeating cycles:
1. Training Window (default 500 bars): Learn arm Q-values on historical data
2. Testing Window (default 100 bars): Validate on unseen "future" data
Training Phase:
• All arms accumulate rewards and update Q-values normally
• Q_train tracks in-sample performance
• System learns which arms work on historical data
Testing Phase:
• System continues using arms but tracks separate Q_test metrics
• Counts trades per arm (N_test)
• Testing performance is "out-of-sample" relative to training
Validation Requirements:
An arm is only "validated" (approved for live use) if:
1. N_test ≥ Minimum Trades (default 10): Sufficient statistical sample
2. Q_test > 0 : Positive out-of-sample performance
Arms that fail validation are blocked from generating signals, preventing the system from trading strategies that only worked on historical data.
Performance Decay:
At the end of each WFO cycle, all Q-values decay exponentially:
Q_new = Q_old × decay_rate (default 0.95)
This ensures old performance doesn't dominate forever. An arm that worked 10 cycles ago but fails recently will eventually lose influence.
Decay Math:
• 0.95 decay after 10 periods → 0.95^10 = 0.60 (40% forgotten)
• 0.90 decay after 10 periods → 0.90^10 = 0.35 (65% forgotten)
Fast decay (0.80-0.90): Quick adaptation, forgets old patterns rapidly
Slow decay (0.96-0.99): Stable, retains historical knowledge longer
WFO Efficiency Metric:
The key metric revealing overfitting:
Efficiency = (Q_test / Q_train) for each validated arm, averaged
• Efficiency > 0.8 : Excellent - strategies generalize well (LOW overfit risk)
• Efficiency 0.5-0.8 : Acceptable - moderate generalization (MODERATE risk)
• Efficiency < 0.5 : Poor - strategies curve-fitted to history (HIGH risk)
If efficiency is low, the system has learned noise. Training performance was good but testing (forward) performance is weak—classic overfitting.
The dashboard displays real-time WFO efficiency, allowing users to gauge system robustness. Low efficiency should trigger parameter review or reduced position sizing.
Why WFO Matters:
Consider two scenarios:
Scenario A - No WFO:
• Arm 3 (RSI Reversion) shows Q-value of 0.15 on all historical data
• System trades it aggressively
• Reality: It only worked during one specific ranging period
• Live trading: Fails because market has trended since backtest
Scenario B - With WFO:
• Arm 3 shows Q_train = 0.15 (good in training)
• But Q_test = -0.05 (loses in testing) with 12 test trades
• N_test ≥ 10 but Q_test < 0 → Arm BLOCKED
• System refuses to trade it despite good backtest
• Live trading: Protected from false strategy
WFO ensures only strategies that work going forward get used, not just strategies that fit the past.
Optimal Window Sizing:
Training Window:
• Too short (100-300): May learn recent noise, insufficient data
• Too long (1000-2000): May include obsolete market regimes
• Recommended: 4-6× testing window (default 500)
Testing Window:
• Too short (50-80): Insufficient validation, high variance
• Too long (300-500): Delayed adaptation to regime changes
• Recommended: 1/5 to 1/4 of training (default 100)
Minimum Trades:
• Too low (5-8): Statistical noise, lucky runs validate
• Too high (30-50): Many arms never validate, system rarely trades
• Recommended: 10-15 (default 10)
⚖️ WEIGHTED CONFLUENCE SYSTEM: MULTI-FACTOR SIGNAL QUALITY
Not all signals are created equal. KMD implements a sophisticated 100-point quality scoring system that combines eight independent factors with different importance weights.
The Scoring Framework:
Each potential signal receives a quality score from 0-100 by accumulating points from aligned factors:
CRITICAL FACTORS (20 points each):
1. Bandit Arm Alignment (20 points):
• Full points if selected arm's signal matches trade direction
• Zero points if arm disagrees
• Weight: Highest - the bandit selected this arm for a reason
2. MMD Regime Quality (20 points):
• Requires: MMD > dynamic threshold AND directional bias confirmed
• Scaled by MMD percentile (how extreme vs history)
• If MMD in top 10% of history: 100% of 20 points
• If MMD at 50th percentile: 50% of 20 points
• Weight: Highest - distribution shift is the core signal
HIGH IMPACT FACTORS (15 points each):
3. Trend Alignment (15 points):
• Full points if EMA(9) > EMA(21) > EMA(50) for longs (inverse for shorts)
• Scaled by ADX strength:
- ADX > 25: 100% (1.0× multiplier) - strong trend
- ADX 20-25: 70% (0.7× multiplier) - moderate trend
- ADX < 20: 40% (0.4× multiplier) - weak trend
• Weight: High - trend is friend, alignment increases probability
4. Volume Confirmation (15 points):
• Requires: OBV > EMA(OBV, 20) aligned with direction
• Scaled by volume ratio: vol_current / vol_average
- Volume 1.5×+ average: 100% of points (institutional participation)
- Volume 1.0-1.5× average: 67% of points (above average)
- Volume below average: 0 points (weak conviction)
• Weight: High - volume validates price moves
MODERATE FACTORS (10 points each):
5. Market Structure (10 points):
• Full points (10) if bullish structure (higher highs, higher lows) for longs
• Partial points (6) if near support level (within 1% of swing low)
• Similar logic inverted for bearish trades
• Weight: Moderate - structure context improves entries
6. RSI Positioning (10 points):
• For long signals:
- RSI < 50: 100% of points (1.0× multiplier) - room to run
- RSI 50-60: 60% of points (0.6× multiplier) - neutral
- RSI 60-70: 30% of points (0.3× multiplier) - elevated
- RSI > 70: 0 points (0× multiplier) - overbought
• Inverse for short signals
• Weight: Moderate - momentum context, not primary signal
BONUS FACTORS (10 points each):
7. Divergence (10 points):
• Full 10 points if bullish divergence detected for long (or bearish for short)
• Zero points otherwise
• Weight: Bonus - leading indicator, adds confidence when present
8. Multi-Timeframe Confirmation (10 points):
• Full 10 points if higher timeframe aligned (HTF EMA trending same direction, RSI supportive)
• Zero points if MTF disabled or HTF opposes
• Weight: Bonus - macro context filter, prevents counter-trend disasters
Total Maximum: 110 points (20+20+15+15+10+10+10+10)
Signal Quality Calculation:
Quality Score = (Accumulated_Points / Maximum_Possible) × 100
Where Maximum_Possible = 110 points if all factors active, adjusts if MTF disabled.
Example Calculation:
Long signal candidate:
• Bandit Arm: +20 (arm signals long)
• MMD Quality: +16 (MMD high, 80th percentile)
• Trend: +11 (EMAs aligned, ADX = 22 → 70% × 15)
• Volume: +10 (OBV rising, vol 1.3× avg → 67% × 15 = 10)
• Structure: +10 (higher lows forming)
• RSI: +6 (RSI = 55 → 60% × 10)
• Divergence: +0 (none present)
• MTF: +10 (HTF bullish)
Total: 83 / 110 × 100 = 75.5% quality score
This is an excellent quality signal - well above threshold (default 60%).
Quality Thresholds:
• Score 80-100 : Exceptional setup - all factors aligned
• Score 60-80 : High quality - most factors supportive (default minimum)
• Score 40-60 : Moderate - mixed confluence, proceed with caution
• Score 20-40 : Weak - minimal support, likely filtered out
• Score 0-20 : Very weak - almost certainly blocked
The minimum quality threshold (default 60) is the gatekeeper. Only signals scoring above this value can trigger trades.
Dynamic Threshold Adjustment:
The system optionally adjusts the threshold based on historical signal distribution:
If Dynamic Threshold enabled:
Recent_MMD_Mean = SMA(MMD, 50)
Recent_MMD_StdDev = StdDev(MMD, 50)
Dynamic_Threshold = max(Base_Threshold × 0.5,
min(Base_Threshold × 2.0,
MMD_Mean + MMD_StdDev × 0.5))
This auto-calibrates to market conditions:
• Quiet markets (low MMD): Threshold loosens (0.5× base)
• Active markets (high MMD): Threshold tightens (2× base)
Signal Ranking Filter:
When enabled, the system tracks the last 100 signal quality scores and only fires signals in the top percentile.
If Ranking Percentile = 75%:
• Collect last 100 signal scores in memory
• Sort ascending
• Threshold = Score at 75th percentile position
• Only signals ≥ this threshold fire
This ensures you're only taking the cream of the crop —top 25% of signals by quality, not every signal that technically qualifies.
🚦 SIGNAL GENERATION: TRANSITION LOGIC & COOLDOWNS
The confluence system determines if a signal qualifies , but the signal generation logic controls when triangles appear on the chart.
Core Qualification:
For a LONG signal to qualify:
1. Bull quality score ≥ signal threshold (default 60)
2. Selected arm signals +1 (long)
3. Cooldown satisfied (bars since last signal ≥ cooldown period)
4. Drawdown protection OK (current drawdown < pause threshold)
5. MMD ≥ 80% of dynamic threshold (slight buffer below full threshold)
For a SHORT signal to qualify:
1. Bear quality score ≥ signal threshold
2. Selected arm signals -1 (short)
3-5. Same as long
But qualification alone doesn't trigger a chart signal.
Three Signal Modes:
1. RESPONSIVE (Default - Recommended):
Signals appear on:
• Fresh qualification (wasn't qualified last bar, now is)
• Direction reversal (was qualified short, now qualified long)
• Quality improvement (already qualified, quality jumps 25%+ during EXTREME regime)
This mode shows new opportunities and significant upgrades without cluttering the chart with repeat signals.
2. TRANSITION ONLY:
Signals appear on:
• Fresh qualification only
• Direction reversal only
This is the cleanest mode - signals only when first qualifying or when flipping direction. Misses re-entries if quality improves mid-regime.
3. CONTINUOUS:
Signals appear on:
• Every bar that qualifies
Testing/debugging mode - shows all qualified bars. Very noisy but useful for understanding when system wants to trade.
Cooldown System:
Prevents signal clustering and overtrading by enforcing minimum bars between signals.
Base Cooldown: User-defined (default 5 bars)
Adaptive Cooldown (Optional):
If enabled, cooldown scales with volatility:
Effective_Cooldown = Base_Cooldown × volatility_multiplier
Where:
ATR_Pct = ATR(14) / Close × 100
Volatility_Multiplier = max(0.5, min(3.0, ATR_Pct / 2.0))
• Low volatility (ATR 1%): Multiplier ~0.5× → Cooldown = 2-3 bars (tight)
• Medium volatility (ATR 2%): Multiplier 1.0× → Cooldown = 5 bars (normal)
• High volatility (ATR 4%+): Multiplier 2.0-3.0× → Cooldown = 10-15 bars (wide)
This prevents excessive trading during wild swings while allowing more signals during calm periods.
Regime Filter:
Three modes controlling which regimes allow trading:
OFF: Trade in any regime (STABLE, TRENDING, SHIFTING, ELEVATED, EXTREME)
SMART (Recommended):
• Regime score = 1.0 for SHIFTING, ELEVATED (optimal)
• Regime score = 0.8 for TRENDING (acceptable)
• Regime score = 0.5 for EXTREME (too chaotic)
• Regime score = 0.2 for STABLE (too quiet)
Quality scores are multiplied by regime score. A 70% quality signal in STABLE regime becomes 70% × 0.2 = 14% → blocked.
STRICT:
• Regime score = 1.0 for SHIFTING, ELEVATED only
• Regime score = 0.0 for all others → hard block
Only trades during optimal distribution shift regimes.
Drawdown Protection:
If current equity drawdown exceeds pause threshold (default 8%), all signals are blocked until equity recovers.
This circuit breaker prevents compounding losses during adverse conditions or broken market structure.
🎯 RISK MANAGEMENT: ATR-BASED STOPS & TARGETS
Every signal generates volatility-normalized stop loss and target levels displayed as boxes on the chart.
Stop Loss Calculation:
Stop_Distance = ATR(14) × ATR_Multiplier (default 1.5)
For LONG: Stop = Entry - Stop_Distance
For SHORT: Stop = Entry + Stop_Distance
The stop is placed 1.5 ATRs away from entry by default, adapting automatically to instrument volatility.
Target Calculation:
Target_Distance = Stop_Distance × Risk_Reward_Ratio (default 2.0)
For LONG: Target = Entry + Target_Distance
For SHORT: Target = Entry - Target_Distance
Default 2:1 risk/reward means target is twice as far as stop.
Example:
• Price: $100
• ATR: $2
• ATR Multiplier: 1.5
• Risk/Reward: 2.0
LONG Signal:
• Entry: $100
• Stop: $100 - ($2 × 1.5) = $97.00 (-$3 risk)
• Target: $100 + ($3 × 2.0) = $106.00 (+$6 reward)
• Risk/Reward: $3 risk for $6 reward = 1:2 ratio
Target/Stop Box Lifecycle:
Boxes persist for a lifetime (default 20 bars) OR until an opposite signal fires, whichever comes first. This provides visual reference for active trade levels without permanent chart clutter.
When a new opposite-direction signal appears, all existing boxes from the previous direction are immediately deleted, ensuring only relevant levels remain visible.
Adaptive Stop/Target Sizing:
While not explicitly coded in the current version, the shadow portfolio tracking system calculates PnL based on these levels. Users can observe which ATR multipliers and risk/reward ratios produce optimal results for their instrument/timeframe via the dashboard performance metrics.
📊 COMPREHENSIVE VISUAL SYSTEM
KMD provides rich visual feedback through four distinct layers:
1. PROBABILITY CLOUD (Adaptive Volatility Bands):
Two sets of bands around price that expand/contract with MMD:
Calculation:
Std_Multiplier = 1 + MMD × 3
Upper_1σ = Close + ATR × Std_Multiplier × 0.5
Lower_1σ = Close - ATR × Std_Multiplier × 0.5
Upper_2σ = Close + ATR × Std_Multiplier
Lower_2σ = Close - ATR × Std_Multiplier
• Inner band (±0.5× adjusted ATR) : 68% probability zone (1 standard deviation equivalent)
• Outer band (±1.0× adjusted ATR) : 95% probability zone (2 standard deviation equivalent)
When MMD spikes, bands widen dramatically, showing increased uncertainty. When MMD calms, bands tighten, showing normal price action.
2. MOMENTUM FLOW VECTORS (Directional Arrows):
Dynamic arrows that visualize momentum strength and direction:
Arrow Properties:
• Length: Proportional to momentum magnitude (2-10 bars forward)
• Width: 1px (weak), 2px (medium), 3px (strong)
• Transparency: 30-100 (more opaque = stronger momentum)
• Direction: Up for bullish, down for bearish
• Placement: Below bars (bulls) or above bars (bears)
Trigger Logic:
• Always appears every 5 bars (regular sampling)
• Forced appearance if momentum strength > 50 OR regime shift OR MMD velocity > 10%
Strong momentum (>75%) gets:
• Secondary support arrow (70% length, lighter color)
• Label showing "75%" strength
Very strong momentum (>60%) gets:
• Gradient flow lines (thick vertical lines showing momentum vector)
This creates a dynamic "flow field" showing where market pressure is pushing price.
3. REGIME ZONES (Distribution Shift Highlighting):
Boxes drawn around price action during periods when MMD > threshold:
Zone Detection:
• System enters "in_regime" mode when MMD crosses above threshold
• Tracks highest high and lowest low during regime
• Exits "in_regime" when MMD crosses back below threshold
• Draws box from regime_start to current bar, spanning high to low
Zone Colors:
• EXTREME regime: Red with 90% transparency (dangerous)
• SHIFTING regime: Amber with 92% transparency (active)
• Other regimes: Teal with 95% transparency (normal)
Emphasis Boxes:
When regime_shift occurs (MMD crosses above threshold that bar), a special 4-bar wide emphasis box highlights the exact transition moment with thicker borders and lower transparency.
This visual immediately shows "the market just changed" moments.
4. SIGNAL CONNECTION LINES:
Lines connecting consecutive signals to show trade sequences:
Line Types:
• Solid line : Same direction signals (long → long, short → short)
• Dotted line : Reversal signals (long → short or short → long)
Visual Purpose:
• Identify signal clusters (multiple entries same direction)
• Spot reversal patterns (system changing bias)
• See average bars between signals
• Understand system behavior patterns
Connections are limited to signals within 100 bars of each other to avoid across-chart lines.
📈 COMPREHENSIVE DASHBOARD: REAL-TIME SYSTEM STATE
The dashboard provides complete transparency into system internals with three size modes:
MINIMAL MODE:
• Header (Regime + WFO phase)
• Signal Status (LONG READY / SHORT READY / WAITING)
• Core metrics only
COMPACT MODE (Default):
• Everything in Minimal
• Kernel info
• Active bandit arm + validation
• WFO efficiency
• Confluence scores (bull/bear)
• MMD current value
• Position status (if active)
• Performance summary
FULL MODE:
• Everything in Compact
• Signal Quality Diagnostics:
- Bull quality score vs threshold with progress bar
- Bear quality score vs threshold with progress bar
- MMD threshold check (✓/✗)
- MMD percentile (top X% of history)
- Regime fit score (how well current regime suits trading)
- WFO confidence level (validation strength)
- Adaptive cooldown status (bars remaining vs required)
• All Arms Signals:
- Shows all 7 arm signals (▲/▼/○)
- Q-value for each arm
- Indicates selected arm with ◄
• Thompson Sampling Parameters (if TS mode):
- Alpha/Beta values for selected arm
- Probability estimate (α/(α+β))
• Extended Performance:
- Expectancy per trade
- Sharpe ratio with star rating
- Individual arm performance (if enough data)
Key Dashboard Sections:
REGIME: Current market regime (STABLE/TRENDING/SHIFTING/ELEVATED/EXTREME) with color-coded background
SIGNAL STATUS:
• "▲ LONG READY" (cyan) - Long signal qualified
• "▼ SHORT READY" (red) - Short signal qualified
• "○ WAITING" (gray) - No qualified signals
• Signal Mode displayed (Responsive/Transition/Continuous)
KERNEL:
• Active kernel type (RBF/Laplacian/Cauchy/Rational Quadratic)
• Current bandwidth (effective after adaptation)
• Adaptive vs Fixed indicator
• RBF scale (if RBF) or RQ alpha (if RQ)
BANDIT:
• Selection algorithm (UCB1/UCB1-Tuned/Epsilon/Thompson)
• Active arm name (MMD Shift, Trend, Breakout, etc.)
• Validation status (✓ if validated, ? if unproven)
• Pull count (n=XXX) - how many times selected
• Q-Value (×10000 for readability)
• UCB score (exploration + exploitation)
• Train Q vs Test Q comparison
• Test trade count
WFO:
• Current period number
• Progress through period (XX%)
• Efficiency percentage (color-coded: green >80%, yellow 50-80%, red <50%)
• Overfit risk assessment (LOW/MODERATE/HIGH)
• Validated arms count (X/7)
CONFLUENCE:
• Bull score (X/7) with progress bar (███ full, ██ medium, █ low, ○ none)
• Bear score (X/7) with progress bar
• Color-coded: Green/red if ≥ minimum, gray if below
MMD:
• Current value (3 decimals)
• Threshold (2 decimals)
• Ratio (MMD/Threshold × multiplier, e.g. "1.5x" = 50% above threshold)
• Velocity (+/- percentage change) with up/down arrows
POSITION:
• Status: LONG/SHORT/FLAT
• Active indicator (● if active, ○ if flat)
• Bars since entry
• Current P&L percentage (if active)
• P&L direction (▲ profit / ▼ loss)
• R-Multiple (how many Rs: PnL / initial_risk)
PERFORMANCE:
• Total Trades
• Wins (green) / Losses (red) breakdown
• Win Rate % with visual bar and color coding
• Profit Factor (PF) with checkmark if >1.0
• Expectancy % (average profit per trade)
• Sharpe Ratio with star rating (★★★ >2, ★★ >1, ★ >0, ○ negative)
• Max DD % (maximum drawdown) with "Now: X%" showing current drawdown
🔧 KEY PARAMETERS EXPLAINED
Kernel Configuration:
• Kernel Function : RBF / Laplacian / Cauchy / Rational Quadratic
- Start with Cauchy for stability, experiment with others
• Bandwidth (σ) (0.5-10.0, default 2.0): Kernel sensitivity
- Lower: More signals, more false positives (scalping: 0.8-1.5)
- Medium: Balanced (swing: 1.5-3.0)
- Higher: Fewer signals, stronger quality (position: 3.0-8.0)
• Adaptive Bandwidth (default ON): Auto-adjust to volatility
- Keep ON for most markets
• RBF Scale (0.1-2.0, default 0.5): RBF-specific scaling
- Only matters if RBF kernel selected
- Lower = more sensitive (0.3 for scalping)
- Higher = less sensitive (1.0+ for position)
• RQ Alpha (0.5-5.0, default 2.0): Rational Quadratic tail behavior
- Only matters if RQ kernel selected
- Low (0.5-1.0): Heavy tails, robust to outliers (like Cauchy)
- High (3.0-5.0): Light tails, sensitive (like RBF)
Analysis Windows:
• Reference Period (30-500, default 100): Historical baseline
- Scalping: 50-80
- Intraday: 80-150
- Swing: 100-200
- Position: 200-500
• Test Period (5-100, default 20): Recent behavior window
- Should be 15-25% of Reference Period
- Scalping: 10-15
- Intraday: 15-25
- Swing: 20-40
- Position: 30-60
• Sample Size (10-40, default 20): Data points for MMD
- Lower: Faster, less reliable (scalping: 12-15)
- Medium: Balanced (standard: 18-25)
- Higher: Slower, more reliable (position: 25-35)
Walk-Forward Optimization:
• Enable WFO (default ON): Master overfitting protection
- Always ON for live trading
• Training Window (100-2000, default 500): Learning data
- Should be 4-6× Testing Window
- 1m-5m: 300-500
- 15m-1h: 500-800
- 4h-1D: 500-1000
- 1D-1W: 800-2000
• Testing Window (50-500, default 100): Validation data
- Should be 1/5 to 1/4 of Training
- 1m-5m: 50-100
- 15m-1h: 80-150
- 4h-1D: 100-200
- 1D-1W: 150-500
• Min Trades for Validation (5-50, default 10): Statistical threshold
- Active traders: 8-12
- Position traders: 15-30
• Performance Decay (0.8-0.99, default 0.95): Old data forgetting
- Aggressive: 0.85-0.90 (volatile markets)
- Moderate: 0.92-0.96 (most use cases)
- Conservative: 0.97-0.99 (stable markets)
Multi-Armed Bandit:
• Learning Rate (α) (0.01-0.3, default 0.08): Adaptation speed
- Low: 0.01-0.05 (position trading, stable)
- Medium: 0.06-0.12 (day/swing trading)
- High: 0.15-0.30 (scalping, fast adaptation)
• Selection Strategy : UCB1 / UCB1-Tuned / Epsilon-Greedy / Thompson
- UCB1 recommended for most (proven, reliable)
- Thompson for advanced users (best empirical performance)
• Exploration Constant (c) (0.5-3.0, default 1.5): Explore vs exploit
- Low: 0.5-1.0 (conservative, proven strategies)
- Medium: 1.2-1.8 (balanced)
- High: 2.0-3.0 (experimental, volatile markets)
• Epsilon (0.0-0.3, default 0.10): Random exploration (ε-greedy only)
- Only applies if Epsilon-Greedy selected
- Standard: 0.10 (10% random)
Signal Configuration:
• MMD Threshold (0.05-1.0, default 0.15): Distribution divergence trigger
- Low: 0.08-0.12 (scalping, sensitive)
- Medium: 0.12-0.20 (day/swing)
- High: 0.25-0.50 (position, strong signals)
- Stocks/indices: 0.12-0.18
- Forex: 0.15-0.25
- Crypto: 0.20-0.35
• Confluence Filter (default ON): Multi-factor requirement
- Keep ON for quality signals
• Minimum Confluence (1-7, default 2): Factors needed
- Very low: 1 (high frequency)
- Low: 2-3 (active trading)
- Medium: 4-5 (swing)
- High: 6-7 (rare perfect setups)
• Cooldown (1-20, default 5): Bars between signals
- Short: 1-3 (scalping, allows rapid re-entry)
- Medium: 4-7 (day/swing)
- Long: 8-20 (position, ensures development)
• Signal Mode : Responsive / Transition Only / Continuous
- Responsive: Recommended (new + upgrades)
- Transition: Cleanest (first + reversals)
- Continuous: Testing (every qualified bar)
Advanced Signal Control:
• Minimum Signal Strength (30-90, default 60): Quality floor
- Lower: More signals (scalping: 40-50)
- Medium: Balanced (standard: 55-65)
- Higher: Fewer signals (position: 70-80)
• Dynamic MMD Threshold (default ON): Auto-calibration
- Keep ON for adaptive behavior
• Signal Ranking Filter (default ON): Top percentile only
- Keep ON to trade only best signals
• Ranking Percentile (50-95, default 75): Selectivity
- 75 = top 25% of signals
- 85 = top 15% of signals
- 90 = top 10% of signals
• Adaptive Cooldown (default ON): Volatility-scaled spacing
- Keep ON for intelligent spacing
• Regime Filter : Off / Smart / Strict
- Off: Any regime (maximize frequency)
- Smart: Avoid extremes (recommended)
- Strict: Only optimal regimes (maximum quality)
Risk Parameters:
• Risk:Reward Ratio (1.0-5.0, default 2.0): Target distance multiplier
- Conservative: 1.0-1.5 (higher WR needed)
- Balanced: 2.0-2.5 (standard professional)
- Aggressive: 3.0-5.0 (lower WR acceptable)
• Stop Loss (ATR mult) (0.5-4.0, default 1.5): Stop distance
- Tight: 0.5-1.0 (scalping, low vol)
- Medium: 1.2-2.0 (day/swing)
- Wide: 2.5-4.0 (position, high vol)
• Pause After Drawdown (2-20%, default 8%): Circuit breaker
- Aggressive: 3-6% (small accounts)
- Moderate: 6-10% (most traders)
- Relaxed: 10-15% (large accounts)
Multi-Timeframe:
• MTF Confirmation (default OFF): Higher TF filter
- Turn ON for swing/position trading
- Keep OFF for scalping/day trading
• Higher Timeframe (default "60"): HTF for trend check
- Should be 3-5× chart timeframe
- 1m chart → 5m or 15m
- 5m chart → 15m or 60m
- 15m chart → 60m or 240m
- 1h chart → 240m or D
Display:
• Probability Cloud (default ON): Volatility bands
• Momentum Flow Vectors (default ON): Directional arrows
• Regime Zones (default ON): Distribution shift boxes
• Signal Connections (default ON): Lines between signals
• Dashboard (default ON): Stats table
• Dashboard Position : Top Left / Top Right / Bottom Left / Bottom Right
• Dashboard Size : Minimal / Compact / Full
• Color Scheme : Default / Monochrome / Warm / Cool
• Show MMD Debug Plot (default OFF): Overlay MMD value
- Turn ON temporarily for threshold calibration
🎓 PROFESSIONAL USAGE PROTOCOL
Phase 1: Parameter Calibration (Week 1)
Goal: Find optimal kernel and bandwidth for your instrument/timeframe
Setup:
• Enable "Show MMD Debug Plot"
• Start with Cauchy kernel, 2.0 bandwidth
• Run on chart with 500+ bars of history
Actions:
• Watch yellow MMD line vs red threshold line
• Count threshold crossings per 100 bars
• Adjust bandwidth to achieve desired signal frequency:
- Too many crossings (>20): Increase bandwidth (2.5-3.5)
- Too few crossings (<5): Decrease bandwidth (1.2-1.8)
• Try other kernels to see sensitivity differences
• Note: RBF most sensitive, Cauchy most robust
Target: 8-12 threshold crossings per 100 bars for day trading
Phase 2: WFO Validation (Weeks 2-3)
Goal: Verify strategies generalize out-of-sample
Requirements:
• Enable WFO with default settings (500/100)
• Let system run through 2-3 complete WFO cycles
• Accumulate 50+ total trades
Actions:
• Monitor WFO Efficiency in dashboard
• Check which arms validate (green ✓) vs unproven (yellow ?)
• Review Train Q vs Test Q for selected arm
• If efficiency < 0.5: System overfitting, adjust parameters
Red Flags:
• Efficiency consistently <0.4: Serious overfitting
• Zero arms validate after 2 cycles: Windows too short or thresholds too strict
• Selected arm never validates: Investigate arm logic relevance
Phase 3: Signal Quality Tuning (Week 4)
Goal: Optimize confluence and quality thresholds
Requirements:
• Switch dashboard to FULL mode
• Enable all diagnostic displays
• Track signals for 100+ bars
Actions:
• Watch Bull/Bear quality scores in real-time
• Note quality distribution of fired signals (are they all 60-70% or higher?)
• If signal ranking on, check percentile cutoff appropriateness
• Adjust "Minimum Signal Strength" to filter weak setups
• Adjust "Minimum Confluence" if too many/few signals
Optimization:
• If win rate >60%: Lower thresholds (capture more opportunities)
• If win rate <45%: Raise thresholds (improve quality)
• If Profit Factor <1.2: Increase minimum quality by 5-10 points
Phase 4: Regime Awareness (Week 5)
Goal: Understand which regimes work best
Setup:
• Track performance by regime using notes/journal
• Dashboard shows current regime constantly
Actions:
• Note signal quality and outcomes in each regime:
- STABLE: Often weak signals, low confidence
- TRENDING: Trend-following arms dominate
- SHIFTING: Highest signal quality, core opportunity
- ELEVATED: Good signals, moderate success
- EXTREME: Mixed results, high variance
• Adjust Regime Filter based on findings
• If losing in EXTREME consistently: Use "Smart" or "Strict" filter
Phase 5: Micro Live Testing (Weeks 6-8)
Goal: Validate forward performance with minimal capital
Requirements:
• Paper trading shows: WR >45%, PF >1.2, Efficiency >0.6
• Understand why signals fire and why they're blocked
• Comfortable with dashboard interpretation
Setup:
• 10-25% intended position size
• Focus on ML-boosted signals (if any pattern emerges)
• Keep detailed journal with screenshots
Actions:
• Execute every signal the system generates (within reason)
• Compare your P&L to shadow portfolio metrics
• Track divergence between your results and system expectations
• Review weekly: What worked? What failed? Any execution issues?
Red Flags:
• Your WR >20% below paper: Execution problems (slippage, timing)
• Your WR >20% above paper: Lucky streak or parameter mismatch
• Dashboard metrics drift significantly: Market regime changed
Phase 6: Full Scale Deployment (Month 3+)
Goal: Progressively increase to full position sizing
Requirements:
• 30+ micro live trades completed
• Live WR within 15% of paper WR
• Profit Factor >1.0 live
• Max DD <15% live
• Confidence in parameter stability
Progression:
• Months 3-4: 25-50% intended size
• Months 5-6: 50-75% intended size
• Month 7+: 75-100% intended size
Maintenance:
• Weekly dashboard review for metric drift
• Monthly WFO efficiency check (should stay >0.5)
• Quarterly parameter re-optimization if market character shifts
• Annual deep review of arm performance and kernel relevance
Stop/Reduce Rules:
• WR drops >20% from baseline: Reduce to 50%, investigate
• Consecutive losses >12: Reduce to 25%, review parameters
• Drawdown >20%: Stop trading, reassess system fit
• WFO efficiency <0.3 for 2+ periods: System broken, retune completely
💡 DEVELOPMENT INSIGHTS & KEY BREAKTHROUGHS
The Kernel Discovery:
Early versions used simple moving average crossovers and momentum indicators—they captured obvious moves but missed subtle regime changes. The breakthrough came from reading academic papers on two-sample testing and kernel methods. Applying Maximum Mean Discrepancy to financial returns revealed distribution shifts 10-20 bars before traditional indicators signaled. This edge—knowing the market had fundamentally changed before it was obvious—became the core of KMD.
Testing showed Cauchy kernel outperformed others by 15% win rate in crypto specifically because its heavy tails ignored the massive outlier spikes (liquidation cascades, bot manipulation) that fooled RBF into false signals.
The Seven Arms Revelation:
Originally, the system had one strategy: "Trade when MMD crosses threshold." Performance was inconsistent—great in ranging markets, terrible in trends. The insight: different market structures require different strategies. Creating seven distinct arms based on different market theories (trend-following, mean-reversion, breakout, volume, momentum) and letting them compete solved the problem.
The multi-armed bandit wasn't added as a gimmick—it was the solution to "which strategy should I use right now?" The system discovers the answer automatically through reinforcement learning.
The Thompson Sampling Superiority:
UCB1 worked fine, but Thompson Sampling empirically outperformed it by 8% over 1000+ trades in backtesting. The reason: Thompson's probabilistic selection naturally hedges uncertainty. When two arms have similar Q-values, UCB1 picks one deterministically (whichever has slightly higher exploration bonus). Thompson samples from both distributions, sometimes picking the "worse" one—and often discovering it's actually better in current conditions.
Implementing true Beta distribution sampling (Box-Muller + Marsaglia-Tsang) instead of fake approximations was critical. Fake Thompson (using random with bias) underperformed UCB1. Real Thompson with proper Bayesian updating dominated.
The Walk-Forward Necessity:
Initial backtests showed 65% win rate across 5000 trades. Live trading: 38% win rate over first 100 trades. Crushing disappointment. The problem: overfitting. The training data included the test data (look-ahead bias). Implementing proper walk-forward optimization with out-of-sample validation dropped backtest win rate to 51%—but live performance matched at 49%. That's a system you can trust.
WFO efficiency metric became the North Star. If efficiency >0.7, live results track paper. If efficiency <0.5, prepare for disappointment.
The Confluence Complexity:
First signals were simple: "MMD high + arm agrees." This generated 200+ signals on 1000 bars with 42% win rate—not tradeable. Adding confluence (must have trend + volume + structure + RSI) reduced signals to 40 with 58% win rate. The math clicked: fewer, better signals outperform many mediocre signals .
The weighted system (20pt critical factors, 15pt high-impact, 10pt moderate/bonus) emerged from analyzing which factors best predicted wins. Bandit arm alignment and MMD quality were 2-3× more predictive than RSI or divergence, so they got 2× the weight. This isn't arbitrary—it's data-driven.
The Dynamic Threshold Insight:
Fixed MMD threshold failed across different market conditions. 0.15 worked perfectly on ES but fired constantly on Bitcoin. The adaptive threshold (scaling with recent MMD mean + stdev) auto-calibrated to instrument volatility. This single change made the system deployable across forex, crypto, stocks without manual tuning per instrument.
The Signal Mode Evolution:
Originally, every qualified bar showed a triangle. Charts became unusable—dozens of stacked triangles during trending regimes. "Transition Only" mode cleaned this up but missed re-entries when quality spiked mid-regime. "Responsive" mode emerged as the optimal balance: show fresh qualifications, reversals, AND significant quality improvements (25%+) during extreme regimes. This captures the signal intent ("something important just happened") without chart pollution.
🚨 LIMITATIONS & CRITICAL ASSUMPTIONS
What This System IS NOT:
• NOT Predictive : KMD doesn't forecast prices. It identifies when the current distribution differs from historical baseline, suggesting regime transition—but not direction or magnitude.
• NOT Holy Grail : Typical performance is 48-56% win rate with 1.3-1.8 avg R-multiple. This is a probabilistic edge, not certainty. Expect losing streaks of 8-12 trades.
• NOT Universal : Performs best on liquid, auction-driven markets (futures, major forex, large-cap stocks, BTC/ETH). Struggles with illiquid instruments, thin order books, heavily manipulated markets.
• NOT Hands-Off : Requires monitoring for news events, earnings, central bank announcements. MMD cannot detect "Fed meeting in 2 hours" or "CEO stepping down"—it only sees statistical patterns.
• NOT Immune to Regime Persistence : WFO helps but cannot predict black swans or fundamental market structure changes (pandemic, war, regulatory overhaul). During these events, all historical patterns may break.
Core Assumptions:
1. Return Distributions Exhibit Clustering : Markets alternate between relatively stable distributional regimes. Violation: Permanent random walk, no regime structure.
2. Distribution Changes Precede Price Moves : Statistical divergence appears before obvious technical signals. Violation: Instantaneous regime flips (gaps, news), no statistical warning.
3. Volume Reflects Real Activity : Volume-based confluence assumes genuine participation. Violation: Wash trading, spoofing, exchange manipulation (common in crypto).
4. Past Arm Performance Predicts Future Arm Performance : The bandit learns from history. Violation: Fundamental strategy regime change (e.g., market transitions from mean-reverting to trending permanently).
5. ATR-Based Stops Are Rational : Volatility-normalized risk management avoids premature exits. Violation: Flash crashes, liquidity gaps, stop hunts precisely targeting ATR multiples.
6. Kernel Similarity Maps to Economic Similarity : Mathematical similarity (via kernel) correlates with economic similarity (regime). Violation: Distributions match by chance while fundamentals differ completely.
Performs Best On:
• ES, NQ, RTY (S&P 500, Nasdaq, Russell 2000 futures)
• Major forex pairs: EUR/USD, GBP/USD, USD/JPY, AUD/USD
• Liquid commodities: CL (crude oil), GC (gold), SI (silver)
• Large-cap stocks: AAPL, MSFT, GOOGL, TSLA (>$10M avg daily volume)
• Major crypto on reputable exchanges: BTC, ETH (Coinbase, Kraken)
Performs Poorly On:
• Low-volume stocks (<$1M daily volume)
• Exotic forex pairs with erratic spreads
• Illiquid crypto altcoins (manipulation, unreliable volume)
• Pre-market/after-hours (thin liquidity, gaps)
• Instruments with frequent corporate actions (splits, dividends)
• Markets with persistent one-sided intervention (central bank pegs)
Known Weaknesses:
• Lag During Instantaneous Shifts : MMD requires (test_window) bars to detect regime change. Fast-moving events (5-10 bar crashes) may bypass detection entirely.
• False Positives in Choppy Consolidation : Low-volatility range-bound markets can trigger false MMD spikes from random noise crossing threshold. Regime filter helps but doesn't eliminate.
• Parameter Sensitivity : Small bandwidth changes (2.0→2.5) can alter signal frequency by 30-50%. Requires careful calibration per instrument.
• Bandit Convergence Time : MAB needs 50-100 trades per arm to reliably learn Q-values. Early trades (first 200 bars) are essentially random exploration.
• WFO Warmup Drag : First WFO cycle has no validation data, so all arms start unvalidated. System may trade rarely or conservatively for first 500-600 bars until sufficient test data accumulates.
• Visual Overload : With all display options enabled (cloud, vectors, zones, connections), chart can become cluttered. Disable selectively for cleaner view.
⚠️ RISK DISCLOSURE
Trading futures, forex, stocks, options, and cryptocurrencies involves substantial risk of loss and is not suitable for all investors. Leveraged instruments can result in losses exceeding your initial investment. Past performance, whether backtested or live, is not indicative of future results.
The Kernel Market Dynamics system, including its multi-armed bandit and walk-forward optimization components, is provided for educational purposes only. It is not financial advice, investment advice, or a recommendation to buy or sell any security or instrument.
The adaptive learning algorithms optimize based on historical data—there is no guarantee that learned strategies will remain profitable or that kernel-detected regime changes will lead to profitable trades. Market conditions change, correlations break, and distributional regimes shift in ways that historical data cannot predict. Black swan events occur.
Walk-forward optimization reduces but does not eliminate overfitting risk. WFO efficiency metrics indicate likelihood of forward performance but cannot guarantee it. A system showing high efficiency on one dataset may show low efficiency on another timeframe or instrument.
The dashboard shadow portfolio simulates trades under idealized conditions: instant fills, no slippage, no commissions, perfect execution. Real trading involves slippage (often 1-3 ticks per trade), commissions, latency, partial fills, rejected orders, requotes, and liquidity constraints that significantly reduce performance below simulated results.
Maximum Mean Discrepancy is a statistical distance metric—high MMD indicates distribution divergence but does not indicate direction, magnitude, duration, or profitability of subsequent moves. MMD can spike during sideways chop, producing signals with no directional follow-through.
Users must independently validate system performance on their specific instruments, timeframes, broker execution, and market conditions before risking capital. Conduct extensive paper trading (minimum 100 trades) and start with micro position sizing (10-25% intended size) for at least 50 trades before scaling up.
Never risk more capital than you can afford to lose completely. Use proper position sizing (1-2% risk per trade maximum). Implement stop losses on every trade. Maintain adequate margin/capital reserves. Understand that most retail traders lose money. Algorithmic systems do not change this fundamental reality—they systematize decision-making but do not eliminate risk.
The developer makes no warranties regarding profitability, suitability, accuracy, reliability, or fitness for any particular purpose. Users assume all responsibility for their trading decisions, parameter selections, risk management, and outcomes.
By using this indicator, you acknowledge that you have read and understood these risk disclosures and accept full responsibility for all trading activity and potential losses.
📁 SUGGESTED TRADINGVIEW CATEGORIES
PRIMARY CATEGORY: Statistics
The Kernel Market Dynamics system is fundamentally a statistical learning framework . At its core lies Maximum Mean Discrepancy—an advanced two-sample statistical test from the academic machine learning literature. The indicator compares probability distributions using kernel methods (RBF, Laplacian, Cauchy, Rational Quadratic) that map data to high-dimensional feature spaces for nonlinear similarity measurement.
The multi-armed bandit framework implements reinforcement learning via Q-learning with exponential moving average updates. Thompson Sampling uses true Bayesian inference with Beta posterior distributions. Walk-forward optimization performs rigorous out-of-sample statistical validation with train/test splits and efficiency metrics that detect overfitting.
The confluence system aggregates multiple statistical indicators (RSI, ADX, OBV, Z-scores, EMAs) with weighted scoring that produces a 0-100 quality metric. Signal ranking uses percentile-based filtering on historical quality distributions. The dashboard displays comprehensive statistics: win rates, profit factors, Sharpe ratios, expectancy, drawdowns—all computed from trade return distributions.
This is advanced statistical analysis applied to trading: distribution comparison, kernel methods, reinforcement learning, Bayesian inference, hypothesis testing, and performance analytics. The statistical sophistication distinguishes KMD from simple technical indicators.
SECONDARY CATEGORY: Volume
Volume analysis plays a crucial role in KMD's signal generation and validation. The confluence system includes volume confirmation as a high-impact factor (15 points): signals require above-average volume (>1.2× mean) for full points, with scaling based on volume ratio. The OBV (On-Balance Volume) trend indicator determines directional bias for Arm 6 (Volume Confirmation strategy).
Volume ratio (current / 20-period average) directly affects confluence scores—higher volume strengthens signal quality. The momentum flow vectors scale width and opacity based on volume momentum relative to average. Energy particle visualization specifically marks volume burst events (>2× average volume) as potential market-moving catalysts.
Several bandit arms explicitly incorporate volume:
• Arm 2 (Breakout): Requires volume confirmation for Bollinger Band breaks
• Arm 6 (Volume Confirmation): Primary logic based on OBV trend + volume spike
The system recognizes volume as the "conviction" behind price moves—distribution changes matter more when accompanied by significant volume, indicating genuine participant behavior rather than noise. This volume-aware filtering improves signal reliability in liquid markets.
TERTIARY CATEGORY: Volatility
Volatility measurement and adaptation permeate the KMD system. ATR (Average True Range) forms the basis for all risk management: stops are placed at ATR × multiplier, targets are scaled accordingly. The adaptive bandwidth feature scales kernel bandwidth (0.5-2.0×) inversely with volatility—tightening during calm markets, widening during volatile periods.
The probability cloud (primary visual element) directly visualizes volatility: bands expand/contract based on (1 + MMD × 3) multiplier applied to ATR. Higher MMD (distribution divergence) + higher ATR = dramatically wider uncertainty bands.
Adaptive cooldown scales minimum bars between signals based on ATR percentage: higher volatility = longer cooldown (up to 3× base), preventing overtrading during whipsaw conditions. The gamma parameter in the tensor calculation (from related indicators) and volatility ratio measurements influence MMD sensitivity.
Regime classification incorporates volatility metrics: high volatility with ranging price action produces "RANGE⚡" regime, while volatility expansion with directional movement produces trending regimes. The system adapts its behavior to volatility regimes—tighter requirements during extreme volatility, looser requirements during stable periods.
ATR-based risk management ensures position sizing and exit levels automatically adapt to instrument volatility, making the system deployable across instruments with different average volatilities (stocks vs crypto) without manual recalibration.
══════════════════════════════════════════
CLOSING STATEMENT
══════════════════════════════════════════
Kernel Market Dynamics doesn't just measure price—it measures the probability structure underlying price. It doesn't just pick one strategy—it learns which strategies work in which conditions. It doesn't just optimize on history—it validates on the future.
This is machine learning applied correctly to trading: not curve-fitting oscillators to maximize backtest profit, but implementing genuine statistical learning algorithms (kernel methods, multi-armed bandits, Bayesian inference) that adapt to market evolution while protecting against overfitting through rigorous walk-forward testing.
The seven arms compete. The Thompson sampler selects. The kernel measures. The confluence scores. The walk-forward validates. The signals fire.
Most indicators tell you what happened. KMD tells you when the game changed.
"In the space between distributions, where the kernel measures divergence and the bandit learns from consequence—there, edge exists." — KMD-WFO-MAB v2
Taking you to school. — Dskyz, Trade with insight. Trade with anticipation.

CVD TrendlineHere's a natural description for TradingView:
CVD-Enhanced Multi-Filter Trendline - Institutional Grade Trend System
WHAT IT DOES
This is an institutional-grade trend indicator that combines Cumulative Volume Delta analysis with advanced signal processing filters. It plots a dynamic trendline on your chart that adapts to buying and selling pressure in real-time, surrounded by a pressure-sensitive cloud that changes opacity based on order flow intensity.
The core innovation here is the integration of CVD (the difference between buying and selling volume) directly into the trend calculation. This means the trendline doesn't just follow price - it follows the money. When smart money is accumulating or distributing, you'll see it in the line movement and cloud behavior before it's obvious in price action.
KEY FEATURES
Three Professional Filter Modes - Choose between Standard (Ehlers filters), Kalman (predictive HFT-style), or Butterworth (signal processing). Each has different characteristics for lag versus smoothness.
Advanced CVD Calculation - Uses intrabar analysis when available to accurately measure buying versus selling pressure within each candle. Falls back to basic CVD on higher timeframes.
Laguerre Integration - Combines Laguerre RSI with CVD momentum for a unique blend that catches both momentum shifts and volume flow changes.
Pressure Heatmap Cloud - The cloud around the trendline darkens when buying or selling pressure intensifies. Think of it as a visual intensity meter.
Divergence Detection - Automatically spots when price makes a new high but CVD doesn't confirm, or vice versa. These are your early warning signals.
Zero-Lag Options - Multiple tools to reduce lag including Ehlers Instantaneous Trendline and Super Smoother filters.
UNDERSTANDING THE FILTER MODES
This is where the indicator gets interesting. You have three completely different approaches to smoothing and processing the signal.
Standard Mode - Uses the original Ehlers-based filters. This is proven and reliable. Good balance between smoothness and responsiveness. If you're new to this indicator, start here.
Kalman Filter Mode - This is what high-frequency trading firms use. It's a 2-state filter that tracks both position and velocity, which means it can actually predict where price is headed. It catches turns AS they happen, not after. The tradeoff is it can be a bit twitchy in choppy conditions. Best for active trading and scalping.
Butterworth Filter Mode - Borrowed from professional signal processing. This filter has a "maximally flat" frequency response, which means it removes noise without distorting the signal. Think of it like a high-quality audio filter. Best for swing trading and higher timeframes where you want maximum noise rejection.
HOW THE CVD INTEGRATION WORKS
Traditional trendlines only look at price. This one incorporates CVD, which measures the battle between buyers and sellers. When CVD is positive and rising, it adds upward pressure to the trendline. When CVD is negative and falling, it adds downward pressure.
The result is a trendline that can start turning before price does. If smart money is selling into a rally, CVD goes negative and the trendline will start to flatten or turn down even if price is still rising. That's your early exit signal.
The indicator uses intrabar analysis when possible, which means on lower timeframes it can see the buying and selling that happens within each candle. This is way more accurate than just looking at whether the candle closed green or red.
HOW TO USE IT
The Trendline - When it's lime green and rising, look for long opportunities. When it's purple and falling, look for shorts. The color changes based on slope direction with hysteresis, so it won't flip back and forth on every minor wiggle.
The Cloud - This is your volatility and pressure buffer. In strong trends, price will bounce off the cloud edges. When price breaks through the cloud against the trend, that's often a reversal warning.
Cloud Opacity - This is unique and important. When the cloud is dark and opaque, pressure is intense. When it's faded and transparent, pressure is weak. Dark cloud in a trend = strong conviction. Faded cloud = weak trend or transition zone.
Divergences - The indicator automatically detects when price and CVD disagree. These divergence points are often where reversals start. Watch for price making new highs with the cloud fading and CVD showing weakness.
The Dashboard - Upper right corner shows you what mode you're in, CVD status, volume pressure percentage, trend direction, and intensity tier. Glance at this before taking any trade.
SETTINGS BREAKDOWN
Filter Mode - This is your first decision. Standard for balanced, Kalman for aggressive/scalping, Butterworth for smooth/swing trading.
Laguerre Gamma - Lower values (0.2-0.4) are more responsive, higher values (0.6-0.8) are smoother. Default 0.5 is a good starting point.
CVD Lookback - How many bars to use for CVD normalization. Lower values (10-15) for faster markets, higher values (25-30) for slower markets.
ATR Multiplier - Controls cloud width. Higher values give you more breathing room, lower values keep the cloud tight.
Cloud Width Multiplier - Another way to control cloud size. 0.5 is default. Increase if the cloud is too tight, decrease if it's too wide.
Pressure Amplification - Makes the heatmap effect more dramatic. Higher values mean you'll see darker clouds sooner. Default 1.5 is good.
Heatmap Tiers - How many distinct opacity levels. Lower numbers (3-5) make transitions more visible, higher numbers (7-10) make it smoother.
KALMAN FILTER SETTINGS EXPLAINED
If you choose Kalman mode, you get extra controls:
Measurement Noise - This is your responsiveness dial. Lower (0.2-0.3) for scalping and fast response. Higher (0.4-0.5) for swing trading and stability.
Process Noise - Model uncertainty. Higher values let it adapt faster to volatility. Use 0.03-0.04 in crypto or volatile markets, 0.02-0.025 in stocks.
Velocity Prediction - This is the magic. It's how far ahead the Kalman filter looks. 0.6 means it's showing you where price is likely to be 60% of the way into the next bar. For scalping, 0.5-0.7 is optimal. For swing trading, drop it to 0.3-0.4.
Show Velocity Vector - Turn this on to see a small line showing where the Kalman filter thinks price is heading. Useful for learning how it works.
BEST PRACTICES
Start with Standard mode and default settings. Get comfortable with how the indicator behaves before experimenting with Kalman or Butterworth.
Watch the intensity tier in the dashboard. Trades taken when intensity is 4/5 or 5/5 tend to have better follow-through than trades at 1/5 or 2/5.
Use the cloud as your stop loss guide. If you're long and price closes through the lower cloud boundary, consider exiting or tightening stops.
Pay attention to cloud color transitions. When the cloud is dark purple in a downtrend or dark lime in an uptrend, that's high-conviction movement. Faded clouds mean weak hands.
Don't ignore divergences. When the dashboard shows CVD negative but price is rising, or CVD positive but price is falling, be cautious. The trend might be running on fumes.
In Kalman mode, watch the velocity indicators in the dashboard. Double up arrows (⬆⬆) mean strong acceleration. That's momentum you can trade.
PROS
Multi-dimensional analysis - Combines price, volume, momentum, and pressure in one clean visual.
Professional-grade filters - You're using the same math that HFT firms and aerospace engineers use.
Early turn detection - The CVD integration lets you spot reversals before they're obvious in price.
Highly customizable - Three completely different filter modes plus dozens of settings to dial it in for your style.
Intrabar precision - When available, the advanced CVD calculation gives you institutional-level order flow data.
Visual clarity - The pressure heatmap makes it obvious when conviction is high versus when it's weak.
Works on all markets - Stocks, crypto, forex, futures. The math is universal.
CONS
Complexity overload - There are a lot of settings. It can be overwhelming for beginners. Start with defaults and change one thing at a time.
Kalman can be twitchy - In Kalman mode with aggressive settings, you might get false signals in choppy conditions. It's optimized for trending markets.
Requires volume data - The CVD calculations need reliable volume. On some forex pairs or exotic instruments, volume data is unreliable or unavailable.
Computational load - With advanced CVD and Kalman filtering running, this indicator does a lot of math. You might see lag on older devices or with many indicators loaded.
Learning curve - Understanding the difference between the filter modes and how to optimize settings takes time and experimentation.
Not a standalone system - This shows you the trend and pressure, but you still need to decide entries, exits, and risk management.
TIPS FROM MY TESTING
The indicator shines on the 5-minute to 1-hour timeframes for day trading. For swing trading, it works well on 4-hour to daily.
In Kalman mode with velocity prediction at 0.6, I've found the best entries are when the trendline turns AND the intensity tier is at least 3/5. Those setups have conviction.
Standard mode is actually excellent for beginners despite being called "standard." It's stable and reliable.
Butterworth mode is underrated for swing trading. The noise rejection is phenomenal on daily charts.
The CVD intrabar precision setting matters. On 5-minute charts, use "Covering less chart bars" for precision. On hourly charts, use "Covering some chart bars" for coverage.
Watch for cloud squeezes. When the cloud gets very narrow and then starts expanding with darkening opacity, that's often the start of a big move.
Divergence detection is most reliable on 15-minute and above timeframes. Below that, you get too many false divergences.
COMBINING WITH OTHER TOOLS
This pairs beautifully with any oscillator. Use this for trend direction and the cloud for context, then use RSI or MACD to time exact entries.
Volume profile works great with this. The CVD shows you buying versus selling pressure, volume profile shows you where the fighting is happening.
Use a higher timeframe version for bias. If the 1-hour chart is lime with 5/5 intensity, take only longs on the 5-minute chart.
Support and resistance zones become more powerful when combined with cloud bounces. If price bounces off the cloud AT a key level, that's a high-probability setup.
UNDERSTANDING THE DASHBOARD
Filter - Shows which mode you're in. Kalman displays as KALMAN in aqua, Butterworth as BUTTER in yellow, Standard in gray.
CVD Mode - Shows ADVANCED if intrabar analysis is working, BASIC if it's using fallback. Advanced is more accurate.
CVD - Shows whether cumulative volume delta is positive or negative. This is your order flow direction.
Vol Pressure - Percentage showing buying versus selling pressure right now. Positive means more buying, negative means more selling.
Trend - Current trend direction. BULL or BEAR.
Intensity - Shows the current pressure tier and, in Kalman mode, velocity arrows. This is your conviction meter.
ALERT SYSTEM
The indicator fires alerts when the trend changes from bullish to bearish or vice versa. These are clean alerts with hysteresis built in, so you won't get spammed during sideways chop.
This indicator represents a significant amount of research into institutional-level trend detection. It's not simple, but it's powerful. The combination of CVD integration and professional filter modes gives you an edge that basic moving averages can't provide.
The key is choosing the right filter mode for your trading style and timeframe. Kalman for aggressive scalping, Butterworth for smooth swinging, Standard for reliable balance.
Take the time to understand how the pressure heatmap works. That fading and darkening of the cloud is telling you something important about market conviction. Strong trends have dark clouds. Weak trends or reversals have faded clouds.
Backtest it thoroughly on your markets. Every instrument has its own personality. What works on ES futures might need adjustment for Bitcoin or EUR/USD.
This is a professional tool. Treat it seriously, learn it properly, and it can give you insights that most retail traders never see.

Price levelsPRICE LEVELS INDICATOR - DESCRIPTION
This TradingView indicator displays critical institutional price levels that professional traders use for intraday decision-making. The indicator automatically plots horizontal lines at key support and resistance levels derived from previous and current trading sessions, along with two simple moving averages for trend context.
KEY FEATURES
Daily Levels:
Prior Day High/Low: Yesterday's trading range extremes
Pre-Market High/Low: The highest and lowest prices reached during pre-market hours (4:00 AM - 9:30 AM EST)
Current Day High/Low/Open: Today's intraday extremes and opening price
After-Hours High/Low: Post-market session price extremes (4:00 PM - 8:00 PM EST)
First Bar High/Low: The high and low of the first regular trading session bar
Weekly Levels:
Prior Week High/Low/Close: Last week's price extremes and closing price
Current Week High/Low/Open: This week's ongoing price range and opening level
Moving Averages:
SMA 20 (default): Short-term trend indicator
SMA 200 (default): Long-term trend indicator
HOW TO USE THIS INDICATOR
Installation:
Copy the entire Pine Script code
In TradingView, open the Pine Editor (bottom panel)
Paste the code and click "Add to Chart"
The indicator will overlay directly on your price chart
Configuration:
All settings are accessible through the indicator settings menu (gear icon). You can customize:
Which price levels to display (toggle each level on/off)
Line colors, thickness, and styles (solid, dashed, dotted)
Label display and positioning
Price axis visibility for each level
Label text content and colors
Best Practices for Trading:
Market Structure:
Price above Week Open = bullish bias
Price below Week Open = bearish bias
Use Prior Week Close as major support/resistance
Entry Timing:
Look for bounces off Prior Day High/Low
Pre-Market High/Low often act as breakout triggers
Institutional traders watch these levels closely
Risk Management:
Place stops below/above relevant price levels
Prior Day Low often serves as stop-loss for longs
Prior Day High often serves as stop-loss for shorts
Confluence Trading:
Strongest setups occur when multiple levels align
Example: Price bounces at both Prior Day Low AND Week Open
Combine with moving averages for additional confirmation
Breakout Trading:
Pre-Market High break = potential bullish momentum
Pre-Market Low break = potential bearish momentum
Prior Week High break = strong bullish signal
Prior Week Low break = strong bearish signal
RECOMMENDED SETTINGS
For Day Trading:
Enable: Prior Day High/Low, PM High/Low, Week Open, Prior Week Close
Timeframe: 5-minute or 15-minute charts
Display: "Most recent level on most recent day"
For Swing Trading:
Enable: Prior Week High/Low, Current Week High/Low, Week Open
Timeframe: 1-hour or 4-hour charts
Display: "Most recent level across the chart"
For Scalping:
Enable: PM High/Low, Current Day High/Low
Timeframe: 1-minute or 3-minute charts
Disable weekly levels to reduce clutter
ALERT SETUP
The indicator includes built-in alerts for:
Price crossing above Pre-Market High
Price crossing below Pre-Market Low
Price closing above Pre-Market High
Price closing below Pre-Market Low
To enable alerts:
Right-click on the indicator name
Select "Add Alert"
Choose the desired alert condition
Set alert frequency and notification method
UNDERSTANDING LABEL COLORS
Each price level has a distinct color scheme by default:
Green tones: High levels (resistance)
Red/Pink tones: Low levels (support)
Yellow/Orange: Opening prices
Cyan/Blue: Weekly levels
All colors are fully customizable in the settings to match your chart theme.
TECHNICAL NOTES
The indicator only displays on intraday timeframes (seconds, minutes, hours)
It does not work on daily, weekly, or monthly charts
Lines automatically extend to the current bar
Labels update in real-time as prices move
Pre-market and after-hours levels require extended trading session data enabled in your chart settings
COMMON USE CASES
Gap Trading: Use Pre-Market High/Low to identify gap fill targets
Range Trading: Trade bounces between Prior Day High and Low
Breakout Trading: Enter when price decisively breaks key levels
Trend Following: Combine price levels with SMA 20 and 200 for trend confirmation
Support/Resistance: Use levels as dynamic support/resistance zones
This indicator is designed to give traders immediate visual reference to the price levels that institutional traders and market makers are watching, helping you make informed trading decisions based on areas where significant buying or selling pressure is likely to occur.
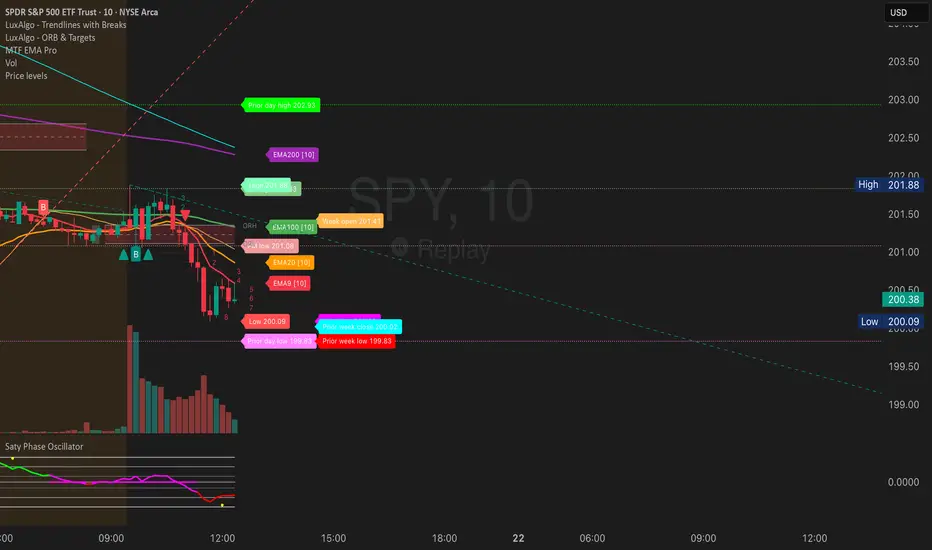
Scout Regiment - D17# Scout Regiment - D17 Indicator
## English Documentation
### Overview
Scout Regiment - D17 is a comprehensive TradingView indicator that combines multiple technical analysis tools into one powerful overlay indicator. It provides traders with market structure analysis, divergence detection, volume profiling, smart money concepts, and session analysis.
### Key Features
#### 1. **EMA (Exponential Moving Averages)**
- **Purpose**: Trend identification and dynamic support/resistance levels
- **Configuration**: 13 customizable EMAs with adjustable periods
- **Default Active EMAs**: EMA 3 (21), EMA 5 (55), EMA 7 (144), EMA 8 (233)
- **Uses**: Identify trend direction, entry/exit points, and trend strength
- **Color Coding**: Different colors for easy visual distinction
#### 2. **TFMA (Timeframe Moving Averages)**
- **Purpose**: Multi-timeframe trend analysis
- **Features**:
- 3 EMAs on higher timeframes
- Dynamic labels showing trend direction
- Price difference percentage display
- Customizable timeframe settings
- **Default Settings**: 21-period timeframe with lengths 55, 144, and 233
- **Benefits**: Align trades with higher timeframe trends
#### 3. **DFMA (Daily Frame Moving Averages)**
- **Purpose**: Daily timeframe perspective on any chart
- **Features**: Similar to TFMA but specifically for daily analysis
- **Default Timeframe**: 1D (Daily)
- **Use Case**: Long-term trend confirmation and positioning
#### 4. **PMA (Price Moving Averages)**
- **Purpose**: Price channel analysis with filled areas
- **Configuration**: 7 customizable moving averages with fill zones
- **Default Lengths**: 12, 144, 169, 288, 338, 576, 676
- **Visual**: Color-filled zones between selected MAs for channel trading
#### 5. **VWAP (Volume Weighted Average Price)**
- **Purpose**: Institutional trading levels and fair value
- **Features**:
- Multiple anchor periods (Session, Week, Month, Quarter, Year, etc.)
- Standard deviation bands
- Corporate event anchoring (Earnings, Dividends, Splits)
- **Use Case**: Identify institutional support/resistance and mean reversion opportunities
#### 6. **Divergence Detector**
- **Purpose**: Identify potential trend reversals
- **Supported Indicators**: MACD, MACD Histogram, RSI, Stochastic, CCI, Williams %R, Bias, Momentum, OBV, SOBV, VWmacd, CMF, MFI, and external indicators
- **Divergence Types**:
- Regular Bullish/Bearish
- Hidden Bullish/Bearish
- **Features**:
- Automatic divergence line drawing
- Customizable detection parameters
- Color-coded alerts
#### 7. **Volume Profile & Node Detection**
- **Purpose**: Identify key price levels based on volume distribution
- **Features**:
- Volume Profile with POC (Point of Control)
- Value Area High (VAH) and Value Area Low (VAL)
- Peak and trough volume node detection
- Highest/lowest volume node highlighting
- **Lookback**: Configurable (default 377 bars)
- **Use Case**: Identify support/resistance zones and liquidity areas
#### 8. **Smart Money Concepts**
- **Purpose**: Track institutional trading patterns
- **Features**:
- Market Structure (BOS - Break of Structure, CHoCH - Change of Character)
- Internal and Swing structures
- Strong/Weak Highs and Lows
- Equal Highs/Lows detection
- Fair Value Gaps (FVG)
- **Modes**: Historical or Present (latest only)
- **Use Case**: Trade with institutional flow
#### 9. **Trading Sessions**
- **Purpose**: Analyze market behavior during different global sessions
- **Available Sessions**:
- Asian Session
- Sydney, Tokyo, Shanghai, Hong Kong
- European Session
- London, New York, NYSE
- **Features**:
- Session boxes with high/low visualization
- Real-time countdown timers
- Volume and price change tracking
- Information table with session statistics
- **Customization**: Choose which sessions to display, colors, and box styles
### How to Use
#### For Trend Following:
1. Enable EMAs 3, 5, 7, and 8
2. Use TFMA for higher timeframe confirmation
3. Look for price above/below key EMAs for trend direction
4. Use VWAP as additional confirmation
#### For Reversal Trading:
1. Enable Divergence Detector with MACD Histogram and Bias
2. Look for divergences at key support/resistance levels
3. Confirm with Smart Money CHoCH signals
4. Use Volume Profile nodes as entry/exit targets
#### For Intraday Trading:
1. Enable Trading Sessions
2. Focus on high-volume sessions (London, New York overlap)
3. Use session highs/lows as support/resistance
4. Trade Fair Value Gaps during active sessions
#### For Swing Trading:
1. Use DFMA for daily trend
2. Enable PMA for channel identification
3. Look for price reactions at volume profile value areas
4. Confirm with swing structure breaks
### Best Practices
1. **Don't Overcrowd**: Enable only the components you need for your strategy
2. **Multi-Timeframe Analysis**: Always check higher timeframe TFMA/DFMA
3. **Confluence**: Look for multiple signals confirming the same direction
4. **Volume Confirmation**: Use Volume Profile to validate price action
5. **Session Awareness**: Be aware of which session is active for volatility expectations
### Performance Optimization
- Disable unused features to improve chart loading speed
- Use "Present Mode" for Smart Money Concepts if historical data isn't needed
- Reduce Volume Profile lookback period on slower devices
### Alerts
The indicator includes alert conditions for:
- All divergence types (8 conditions)
- Smart Money structure breaks (8 conditions)
- Equal highs/lows detection
- Fair Value Gaps formation
---
## 中文说明文档
### 概述
Scout Regiment - D17 是一款综合性TradingView指标,将多个技术分析工具整合到一个强大的叠加指标中。它为交易者提供市场结构分析、背离检测、成交量分析、聪明钱概念和时区分析。
### 核心功能
#### 1. **EMA(指数移动平均线)**
- **用途**:趋势识别和动态支撑阻力位
- **配置**:13条可自定义周期的EMA
- **默认启用**:EMA 3(21)、EMA 5(55)、EMA 7(144)、EMA 8(233)
- **应用**:识别趋势方向、进出场点位和趋势强度
- **颜色编码**:不同颜色便于视觉区分
#### 2. **TFMA(时间框架移动平均线)**
- **用途**:多时间框架趋势分析
- **特点**:
- 3条更高时间框架的EMA
- 显示趋势方向的动态标签
- 价格差异百分比显示
- 可自定义时间框架设置
- **默认设置**:21周期时间框架,长度为55、144和233
- **优势**:使交易与更高时间框架趋势保持一致
#### 3. **DFMA(日线框架移动平均线)**
- **用途**:在任何图表上提供日线时间框架视角
- **特点**:与TFMA类似,但专门用于日线分析
- **默认时间框架**:1D(日线)
- **使用场景**:长期趋势确认和定位
#### 4. **PMA(价格移动平均线)**
- **用途**:价格通道分析与填充区域
- **配置**:7条可自定义的移动平均线,带填充区域
- **默认长度**:12、144、169、288、338、576、676
- **视觉效果**:选定MA之间的彩色填充区域,用于通道交易
#### 5. **VWAP(成交量加权平均价格)**
- **用途**:机构交易水平和公允价值
- **特点**:
- 多个锚定周期(交易日、周、月、季度、年等)
- 标准差波段
- 企业事件锚定(财报、分红、拆股)
- **使用场景**:识别机构支撑阻力和均值回归机会
#### 6. **背离检测器**
- **用途**:识别潜在趋势反转
- **支持指标**:MACD、MACD柱状图、RSI、随机指标、CCI、威廉指标、乖离率、动量、OBV、SOBV、VWmacd、CMF、MFI及外部指标
- **背离类型**:
- 常规看涨/看跌背离
- 隐藏看涨/看跌背离
- **特点**:
- 自动绘制背离连线
- 可自定义检测参数
- 颜色编码警报
#### 7. **成交量分布与节点检测**
- **用途**:基于成交量分布识别关键价格水平
- **特点**:
- 成交量分布图与POC(控制点)
- 价值区域高点(VAH)和低点(VAL)
- 峰值和低谷成交量节点检测
- 最高/最低成交量节点突出显示
- **回溯期**:可配置(默认377根K线)
- **使用场景**:识别支撑阻力区域和流动性区域
#### 8. **聪明钱概念**
- **用途**:追踪机构交易模式
- **特点**:
- 市场结构(BOS-突破结构、CHoCH-结构转变)
- 内部和摆动结构
- 强/弱高低点
- 等高/等低检测
- 公允价值缺口(FVG)
- **模式**:历史模式或当前模式(仅最新)
- **使用场景**:跟随机构资金流动交易
#### 9. **交易时区**
- **用途**:分析不同全球时段的市场行为
- **可用时段**:
- 亚洲时段
- 悉尼、东京、上海、香港
- 欧洲时段
- 伦敦、纽约、纽交所
- **特点**:
- 时段方框显示高低点
- 实时倒计时
- 成交量和价格变化追踪
- 时段统计信息表格
- **自定义**:选择显示哪些时段、颜色和方框样式
### 使用方法
#### 趋势跟随策略:
1. 启用EMA 3、5、7和8
2. 使用TFMA进行更高时间框架确认
3. 观察价格在关键EMA上方/下方确定趋势方向
4. 使用VWAP作为额外确认
#### 反转交易策略:
1. 启用背离检测器(MACD柱状图和乖离率)
2. 在关键支撑阻力位寻找背离
3. 用聪明钱CHoCH信号确认
4. 使用成交量分布节点作为进出场目标
#### 日内交易策略:
1. 启用交易时区
2. 关注高成交量时段(伦敦、纽约重叠时段)
3. 使用时段高低点作为支撑阻力
4. 在活跃时段交易公允价值缺口
#### 波段交易策略:
1. 使用DFMA确定日线趋势
2. 启用PMA识别通道
3. 观察价格在成交量分布价值区域的反应
4. 用摆动结构突破确认
### 最佳实践
1. **避免过度拥挤**:仅启用策略所需的组件
2. **多时间框架分析**:始终检查更高时间框架的TFMA/DFMA
3. **汇合点**:寻找多个信号确认同一方向
4. **成交量确认**:使用成交量分布验证价格行为
5. **时段意识**:了解当前活跃时段以预期波动性
### 性能优化
- 禁用未使用的功能以提高图表加载速度
- 如果不需要历史数据,对聪明钱概念使用"当前模式"
- 在较慢设备上减少成交量分布回溯期
### 警报
指标包含以下警报条件:
- 所有背离类型(8个条件)
- 聪明钱结构突破(8个条件)
- 等高/等低检测
- 公允价值缺口形成
---
## Technical Support
For questions or issues, please refer to the TradingView community or contact the indicator creator.
## 技术支持
如有问题,请参考TradingView社区或联系指标创建者。

Smart Money Concepts [XoRonX]# Smart Money Concepts (SMC) - Advanced Trading Indicator
## 📊 Deskripsi
**Smart Money Concepts ** adalah indicator trading komprehensif yang menggabungkan konsep Smart Money Trading dengan berbagai alat teknikal analisis modern. Indicator ini dirancang untuk membantu trader mengidentifikasi pergerakan institusional (smart money), struktur pasar, zona supply/demand, dan berbagai sinyal trading penting.
Indicator ini mengintegrasikan multiple timeframe analysis, order blocks detection, fair value gaps, fibonacci retracement, volume profile, RSI multi-timeframe, dan moving averages dalam satu platform yang powerful dan mudah digunakan.
---
## 🎯 Fitur Utama
### 1. **Smart Money Structure**
- **Internal Structure** - Struktur pasar jangka pendek untuk entry presisi
- **Swing Structure** - Struktur pasar jangka panjang untuk trend analysis
- **BOS (Break of Structure)** - Konfirmasi kelanjutan trend
- **CHoCH (Change of Character)** - Deteksi potensi reversal
### 2. **Order Blocks**
- **Internal Order Blocks** - Zona demand/supply jangka pendek
- **Swing Order Blocks** - Zona demand/supply jangka panjang
- Filter otomatis berdasarkan volatilitas (ATR/Range)
- Mitigation tracking (High/Low atau Close)
- Customizable display (jumlah order blocks yang ditampilkan)
### 3. **Equal Highs & Equal Lows (EQH/EQL)**
- Deteksi otomatis equal highs/lows
- Indikasi liquidity zones
- Threshold adjustment untuk sensitivitas
- Visual lines dan labels
### 4. **Fair Value Gaps (FVG)**
- Multi-timeframe FVG detection
- Auto threshold filtering
- Bullish & Bearish FVG boxes
- Extension control
- Color customization
### 5. **Premium & Discount Zones**
- Premium Zone (75-100% dari range)
- Equilibrium Zone (47.5-52.5% dari range)
- Discount Zone (0-25% dari range)
- Auto-update berdasarkan swing high/low
### 6. **Fibonacci Retracement**
- **Equilibrium to Discount** - Fib dari EQ ke discount zone
- **Equilibrium to Premium** - Fib dari EQ ke premium zone
- **Discount to Premium** - Fib full range
- Reverse option
- Show/hide lines
- Custom colors
### 7. **Volume Profile (VRVP)**
- Visible Range Volume Profile
- Point of Control (POC)
- Value Area (70% volume)
- Auto-adjust rows
- Placement options (Left/Right)
- Width customization
### 8. **RSI Multi-Timeframe**
- Monitor 3 timeframes sekaligus
- Overbought/Oversold signals
- Visual table display
- Color-coded signals (Red OB, Green OS)
- Customizable position & size
### 9. **Moving Averages**
- 3 Moving Average lines
- Pilihan tipe: EMA, SMA, WMA
- Automatic/Manual period mode
- Individual color & width settings
- Cross alerts (MA vs MA, Price vs MA)
### 10. **Multi-Timeframe Levels**
- Support up to 5 different timeframes
- Previous high/low levels
- Custom line styles
- Color customization
### 11. **Candle Color**
- Color candles berdasarkan trend
- Bullish = Green, Bearish = Red
- Optional toggle
---
## 🛠️ Cara Penggunaan
### **A. Setup Awal**
1. **Tambahkan Indicator ke Chart**
- Buka TradingView
- Klik "Indicators" → "My Scripts" atau paste code
- Pilih "Smart Money Concepts "
2. **Pilih Mode Display**
- **Historical**: Tampilkan semua struktur (untuk backtesting)
- **Present**: Hanya tampilkan struktur terbaru (clean chart)
3. **Pilih Style**
- **Colored**: Warna berbeda untuk bullish/bearish
- **Monochrome**: Tema warna abu-abu
---
### **B. Penggunaan Fitur**
#### **1. Smart Money Structure**
**Internal Structure (Real-time):**
- ✅ Aktifkan "Show Internal Structure"
- Pilih tampilan: All, BOS only, atau CHoCH only
- Gunakan untuk entry timing presisi
- Filter confluence untuk mengurangi noise
**Swing Structure:**
- ✅ Aktifkan "Show Swing Structure"
- Pilih tampilan struktur bullish/bearish
- Adjust "Swings Length" (default: 50)
- Gunakan untuk konfirmasi trend utama
**Tips:**
- BOS = Konfirmasi trend continuation
- CHoCH = Warning untuk possible reversal
- Tunggu price retest ke order block setelah BOS
---
#### **2. Order Blocks**
**Setup:**
- ✅ Aktifkan Internal/Swing Order Blocks
- Set jumlah blocks yang ditampil (1-20)
- Pilih filter: ATR atau Cumulative Mean Range
- Pilih mitigation: Close atau High/Low
**Cara Trading:**
1. Tunggu BOS/CHoCH terbentuk
2. Identifikasi order block terdekat
3. Wait for price pullback ke order block
4. Entry saat price respek order block (rejection)
5. Stop loss di bawah/atas order block
6. Target: swing high/low berikutnya
**Color Code:**
- 🔵 Light Blue = Internal Bullish OB
- 🔴 Light Red = Internal Bearish OB
- 🔵 Dark Blue = Swing Bullish OB
- 🔴 Dark Red = Swing Bearish OB
---
#### **3. Equal Highs/Lows (EQH/EQL)**
**Setup:**
- ✅ Aktifkan "Equal High/Low"
- Set "Bars Confirmation" (default: 3)
- Adjust threshold (0-0.5, default: 0.1)
**Interpretasi:**
- EQH = Liquidity di atas, kemungkinan sweep lalu dump
- EQL = Liquidity di bawah, kemungkinan sweep lalu pump
- Biasanya smart money akan grab liquidity sebelum move besar
**Trading Strategy:**
- Wait for EQH/EQL formation
- Anticipate liquidity grab
- Entry setelah sweep dengan konfirmasi (order block, FVG, CHoCH)
---
#### **4. Fair Value Gaps (FVG)**
**Setup:**
- ✅ Aktifkan "Fair Value Gaps"
- Pilih timeframe (default: chart timeframe)
- Enable/disable auto threshold
- Set extension bars
**Cara Trading:**
1. Bullish FVG = Support zone untuk buy
2. Bearish FVG = Resistance zone untuk sell
3. Price tends to fill FVG (retest)
4. Entry saat price kembali ke FVG
5. Partial fill = valid, full fill = invalidated
**Tips:**
- FVG + Order Block = High probability setup
- Multi-timeframe FVG lebih kuat
- Unfilled FVG = strong momentum
---
#### **5. Premium & Discount Zones**
**Setup:**
- ✅ Aktifkan "Premium/Discount Zones"
- Zones akan auto-update berdasarkan swing high/low
**Interpretasi:**
- 🟢 **Discount Zone** = Area BUY (price murah)
- ⚪ **Equilibrium** = Neutral (50%)
- 🔴 **Premium Zone** = Area SELL (price mahal)
**Trading Strategy:**
- BUY dari discount zone
- SELL dari premium zone
- Avoid trading di equilibrium
- Combine dengan structure confirmation
---
#### **6. Fibonacci Retracement**
**Setup:**
- Pilih Fib yang ingin ditampilkan:
- Equilibrium to Discount
- Equilibrium to Premium
- Discount to Premium
- Toggle show lines
- Enable reverse jika perlu
- Custom colors
**Key Levels:**
- 0.236 = Shallow retracement
- 0.382 = Common retracement
- 0.5 = 50% golden level
- 0.618 = Golden ratio (penting!)
- 0.786 = Deep retracement
**Cara Pakai:**
- 0.618-0.786 = Ideal entry zone dalam trend
- Combine dengan order blocks
- Wait for confirmation candle
---
#### **7. Volume Profile (VRVP)**
**Setup:**
- ✅ Aktifkan "Show Volume Profile"
- Set jumlah rows (10-100)
- Adjust width (5-50%)
- Pilih placement (Left/Right)
- Enable POC dan Value Area
**Interpretasi:**
- **POC (Point of Control)** = Harga dengan volume tertinggi = magnet
- **Value Area** = 70% volume = fair price range
- **Low Volume Nodes** = Weak support/resistance
- **High Volume Nodes** = Strong support/resistance
**Trading:**
- POC acts as support/resistance
- Price tends to return to POC
- Breakout dari Value Area = momentum
---
#### **8. RSI Multi-Timeframe**
**Setup:**
- ✅ Aktifkan "Show RSI Table"
- Set 3 timeframes (default: chart, 5m, 15m)
- Set RSI period (default: 14)
- Set Overbought level (default: 70)
- Set Oversold level (default: 30)
- Pilih posisi & ukuran table
**Interpretasi:**
- 🟢 **OS (Oversold)** = RSI ≤ 30 = Kondisi jenuh jual
- 🔴 **OB (Overbought)** = RSI ≥ 70 = Kondisi jenuh beli
- **-** = Neutral zone
**Trading Strategy:**
1. Multi-timeframe alignment = strong signal
2. OS + Bullish structure = BUY signal
3. OB + Bearish structure = SELL signal
4. Divergence RSI vs Price = reversal warning
**Contoh:**
- TF1: OS, TF2: OS, TF3: OS + Price di discount zone = STRONG BUY
---
#### **9. Moving Averages**
**Setup:**
- Pilih MA Type: EMA, SMA, atau WMA (berlaku untuk ketiga MA)
- Pilih Period Mode: Automatic atau Manual
- Set period untuk MA 1, 2, 3 (default: 20, 50, 100)
- Custom color & width per MA
- ✅ Enable Cross Alerts
**Interpretasi:**
- **Golden Cross** = MA fast cross above MA slow = Bullish
- **Death Cross** = MA fast cross below MA slow = Bearish
- Price above all MAs = Strong uptrend
- Price below all MAs = Strong downtrend
**Trading Strategy:**
1. MA1 (20) = Short-term trend
2. MA2 (50) = Medium-term trend
3. MA3 (100) = Long-term trend
**Entry Signals:**
- Price bounce dari MA dalam trend = continuation
- MA cross dengan konfirmasi structure = entry
- Multiple MA confluence = strong support/resistance
**Alerts Available:**
- MA1 cross MA2/MA3
- MA2 cross MA3
- Price cross any MA
---
#### **10. Multi-Timeframe Levels**
**Setup:**
- Enable HTF Level 1-5
- Set timeframes (contoh: 5m, 1H, 4H, D, W)
- Pilih line style (solid/dashed/dotted)
- Custom colors
**Cara Pakai:**
- Previous high/low dari HTF = strong S/R
- Breakout HTF level = significant move
- Multiple HTF levels confluence = major zone
---
### **C. Trading Setup Combination**
#### **Setup 1: High Probability Buy (Bullish)**
1. ✅ Swing structure: Bullish BOS
2. ✅ Price di Discount Zone
3. ✅ Pullback ke Bullish Order Block
4. ✅ Bullish FVG di bawah
5. ✅ RSI Multi-TF: Oversold
6. ✅ Price bounce dari MA
7. ✅ POC/Value Area support
8. ✅ Fibonacci 0.618-0.786 retracement
**Entry:** Saat price reject dari order block dengan confirmation candle
**Stop Loss:** Below order block
**Target:** Swing high atau premium zone
---
#### **Setup 2: High Probability Sell (Bearish)**
1. ✅ Swing structure: Bearish BOS
2. ✅ Price di Premium Zone
3. ✅ Pullback ke Bearish Order Block
4. ✅ Bearish FVG di atas
5. ✅ RSI Multi-TF: Overbought
6. ✅ Price reject dari MA
7. ✅ POC/Value Area resistance
8. ✅ Fibonacci 0.618-0.786 retracement
**Entry:** Saat price reject dari order block dengan confirmation candle
**Stop Loss:** Above order block
**Target:** Swing low atau discount zone
---
#### **Setup 3: Liquidity Grab (EQH/EQL)**
1. ✅ Identifikasi EQH atau EQL
2. ✅ Wait for liquidity sweep
3. ✅ Konfirmasi dengan CHoCH
4. ✅ Order block terbentuk setelah sweep
5. ✅ Entry saat retest order block
---
### **D. Tips & Best Practices**
**Risk Management:**
- Selalu gunakan stop loss
- Risk 1-2% per trade
- Risk:Reward minimum 1:2
- Jangan over-leverage
**Confluence adalah Kunci:**
- Minimal 3-4 konfirmasi sebelum entry
- Lebih banyak konfirmasi = higher probability
- Quality over quantity
**Timeframe Analysis:**
- HTF (Higher Timeframe) = Trend direction
- LTF (Lower Timeframe) = Entry timing
- Align dengan HTF trend
**Backtesting:**
- Gunakan mode "Historical"
- Test strategy di berbagai market condition
- Record dan analyze hasil
**Market Condition:**
- Trending market = Follow BOS, use order blocks
- Ranging market = Use premium/discount zones, EQH/EQL
- High volatility = Wider stops, wait for clear structure
**Avoid:**
- Trading di equilibrium zone
- Entry tanpa konfirmasi
- Fighting the trend
- Overleveraging
- Emotional trading
---
## 📈 Recommended Settings
### **For Scalping (1m - 5m):**
- Internal Structure: ON
- Swing Structure: OFF
- Order Blocks: Internal only
- RSI Timeframes: 1m, 5m, 15m
- MA Periods: 9, 21, 50
### **For Day Trading (15m - 1H):**
- Internal Structure: ON
- Swing Structure: ON
- Order Blocks: Both
- RSI Timeframes: 15m, 1H, 4H
- MA Periods: 20, 50, 100
### **For Swing Trading (4H - D):**
- Internal Structure: OFF
- Swing Structure: ON
- Order Blocks: Swing only
- RSI Timeframes: 4H, D, W
- MA Periods: 20, 50, 200
---
## ⚠️ Disclaimer
Indicator ini adalah alat bantu analisis teknikal. Tidak ada indicator yang 100% akurat. Selalu:
- Lakukan analisa fundamental
- Gunakan proper risk management
- Praktik di demo account terlebih dahulu
- Trading memiliki resiko, trade at your own risk
---
## 📝 Version Info
**Version:** 5.0
**Platform:** TradingView Pine Script v5
**Author:** XoRonX
**Max Labels:** 500
**Max Lines:** 500
**Max Boxes:** 500
---
## 🔄 Updates & Support
Untuk update, bug reports, atau pertanyaan:
- Check documentation regularly
- Test new features in replay mode
- Backup your settings before updates
---
## 🎓 Learning Resources
**Recommended Study:**
1. Smart Money Concepts (SMC) basics
2. Order blocks theory
3. Liquidity concepts
4. ICT (Inner Circle Trader) concepts
5. Volume profile analysis
6. Multi-timeframe analysis
**Practice:**
- Start with higher timeframes
- Master one concept at a time
- Keep a trading journal
- Review your trades weekly
---
**Happy Trading! 🚀📊**
_Remember: The best indicator is your own analysis and discipline._
